|
RAPIDLY EVOLVING SOLAR SYSTEM SCIENCE
|
My second presentation in this series on Rapidly Evolving Solar System Science (Slides & Text or Video) was entitled “Chondrules” … and focused on understanding what was happening in the early Solar System between 0-5 Myrs after the formation of the very first objects : calcium-aluminium inclusions (CAIs) that we find in chondritic meteorites. We saw how the new thinking indicates that chondrules and chondrites are a by-product of the accretionary process - and not a precursor - as was classically thought until very recently.
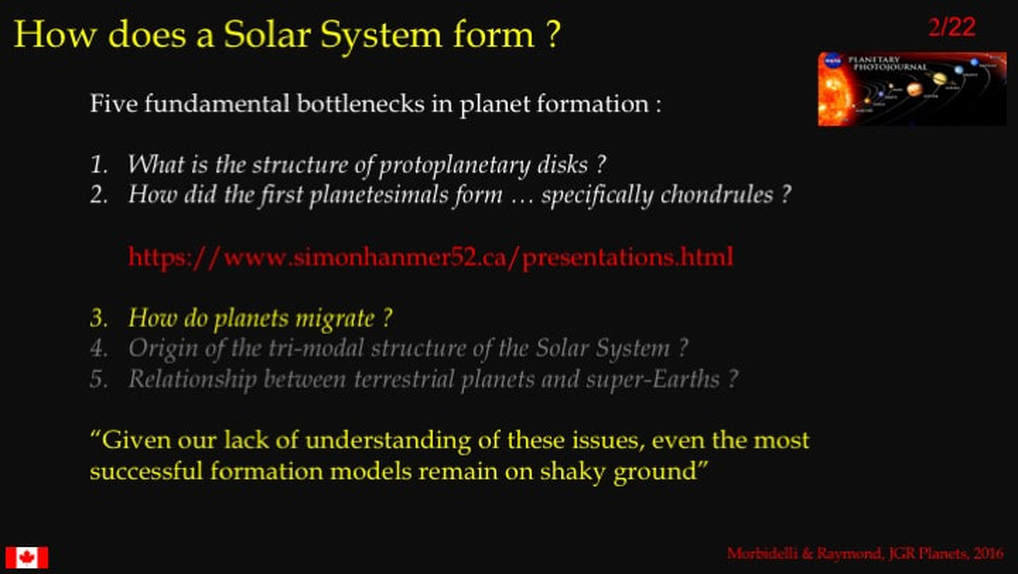
In my first two presentations in this series – regarding the behaviour of the protoplanetary accretionary disk and the formation of chondrules - I showed this list of the five fundamental “headaches” confronting professional planetary scientists trying to understand Solar System formation today. Here we’re going to shift our attention to the behaviour of planets during the first half-billion years of Solar System history and examine “headache” number 3 : Did the Giant Planets migrate, and if so – how and when ?
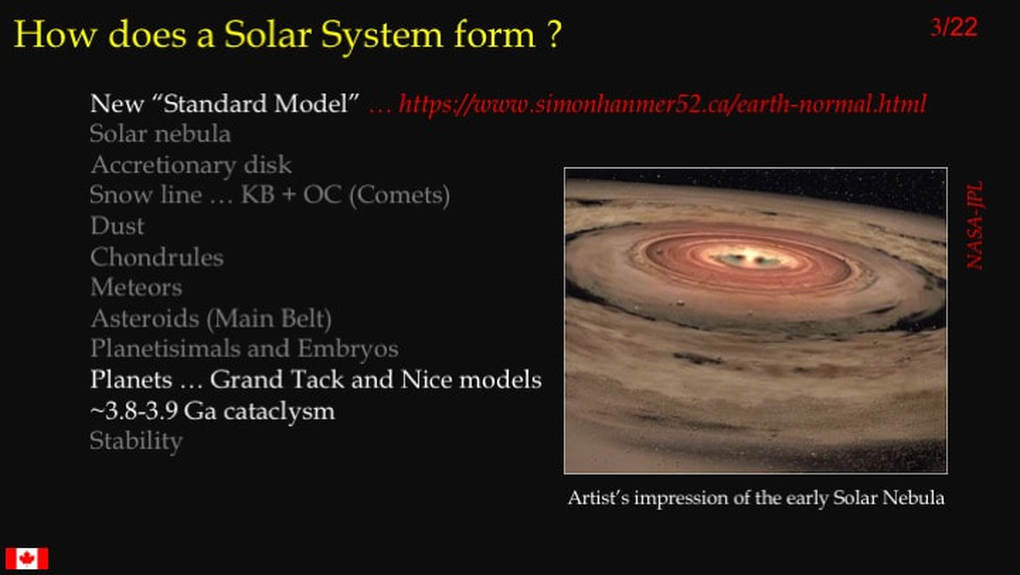
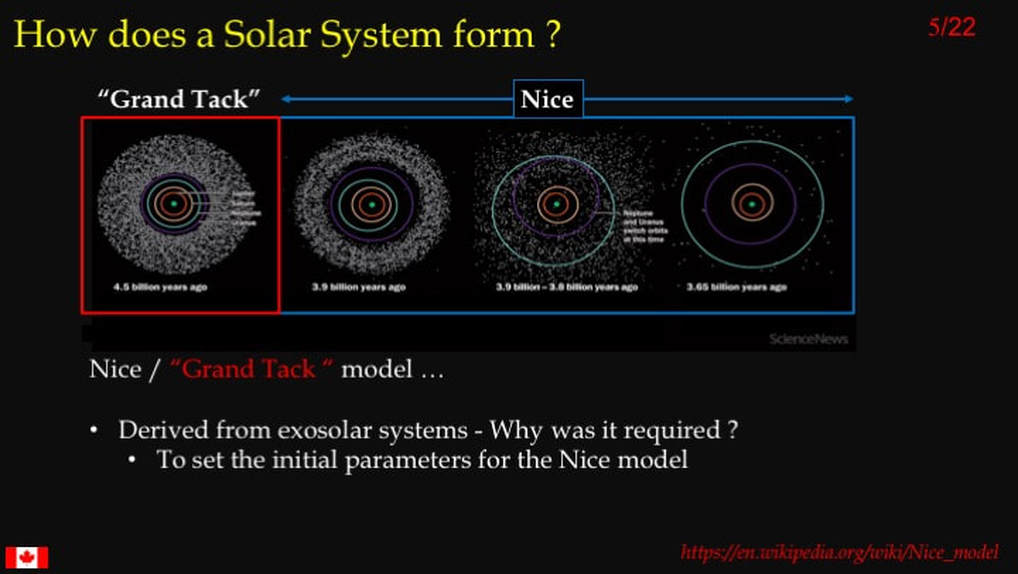
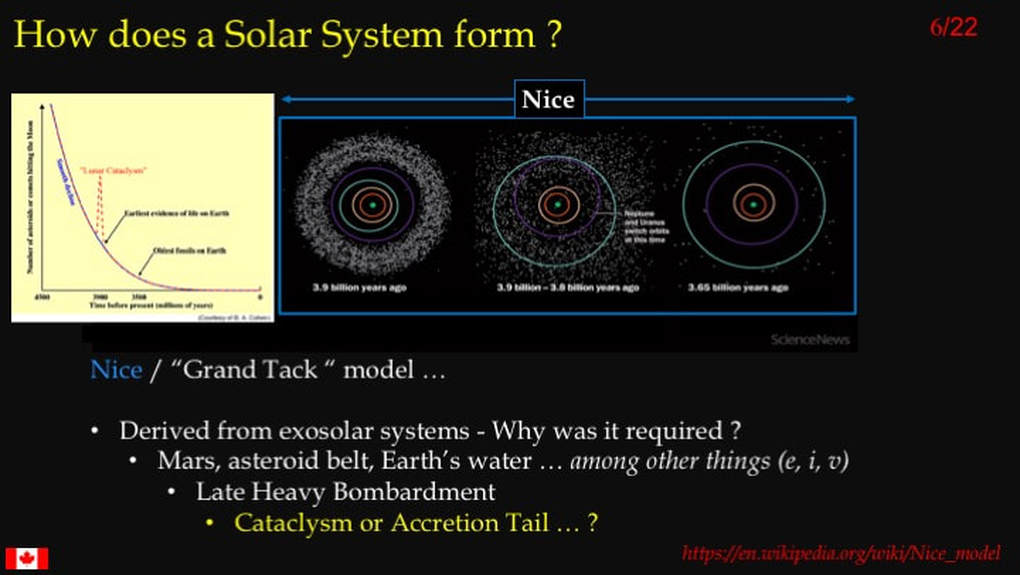
In other words, we’re going to look at how the Nice / Grand Tack model of the migration of Jupiter and Saturn impacted the ongoing evolution of the rest of the Solar System, paying particular attention to when it might have happened. This is important because it has implications for the cataclysmic Late Heavy Bombardment that is supposed to have occurred at ~3.8-3.9 Ga - if it happened at all. This is important because our understanding of when things happened on the different bodies that make up our Solar System is currently all hinged on the Late Heavy Bombardment - and the assumption that it really occurred.
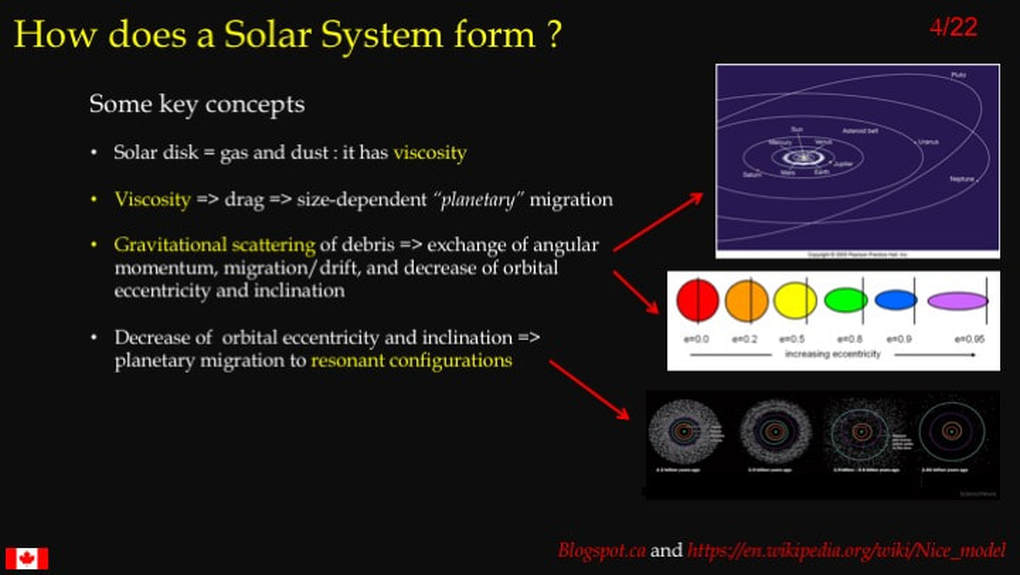
Before we go any further, I should define some key concepts. Gravitational scattering of debris is a multi-facetted process whereby gravitational interactions with planets – not physical collisions - scatter accretionary disk debris either inward or outward, leading variously to (i) exchange of angular momentum between accretionary debris and the planets doing the scattering ; (ii) migration/drift of the scattering planets as that angular momentum is exchanged ; and (iii) decrease of orbital eccentricity and orbital inclination of those same planets. Most importantly, decrease of orbital eccentricity and inclination itself can lead to planetary migration to new resonant orbital configurations, where pairs of planets change the ratio of their orbits around the Sun (e.g. 3/2 => 2/1).
Why has the Nice / Grand Tack model taken centre stage in recent thinking about Solar System evolution ? Quite simply, because it is very seductive : it seems to explain a lot of otherwise difficult to explain observations. For example, it predicts that Mars should be smaller than the other Rocky Planets (Earth and Venus). It predicts the zoned structure of the asteroid belt. It can even provide an explanation for how water ended up so abundant on Earth. Mathematically, it can even account for the observed orbital eccentricities and inclinations of the planets and their velocities.
The Grand Tack component of the model predicts that the evolving orbital resonances of Jupiter and Saturn pushed the two gas giants to migrate outward (away from the Sun) after an initial inward migration.
The Grand Tack component of the model predicts that the evolving orbital resonances of Jupiter and Saturn pushed the two gas giants to migrate outward (away from the Sun) after an initial inward migration.
The Nice component of the model predicts that Uranus and Neptune were also pushed outward into the Kuiper belt of comets and planetisimals that were gravitationally flung back toward the Sun, colliding with the planets and their moons, during what became known as the Late Heavy Bombardment. In other words, the Nice / Grand Tack model is pretty much required if we are to explain the Late Heavy Bombardment.
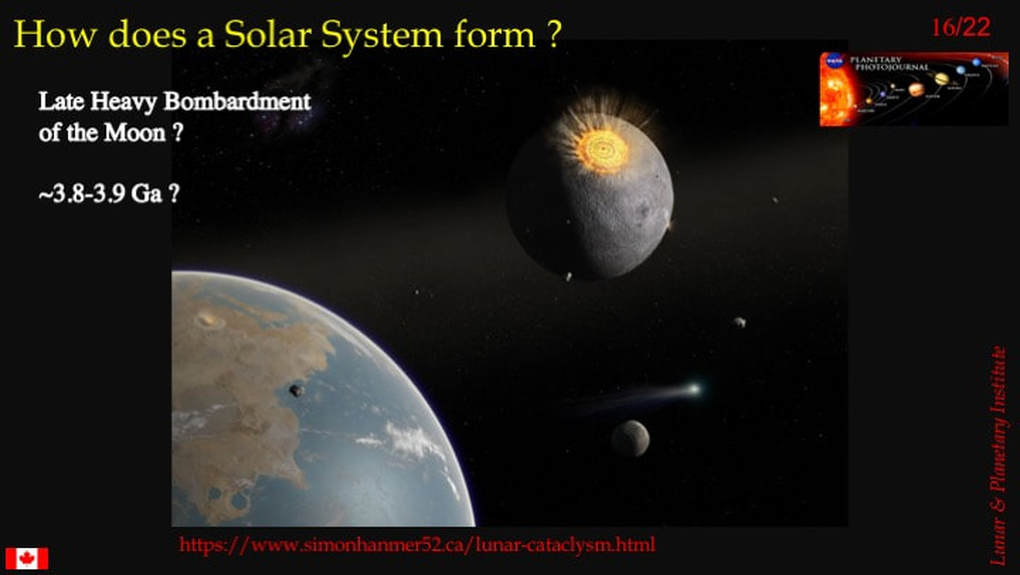
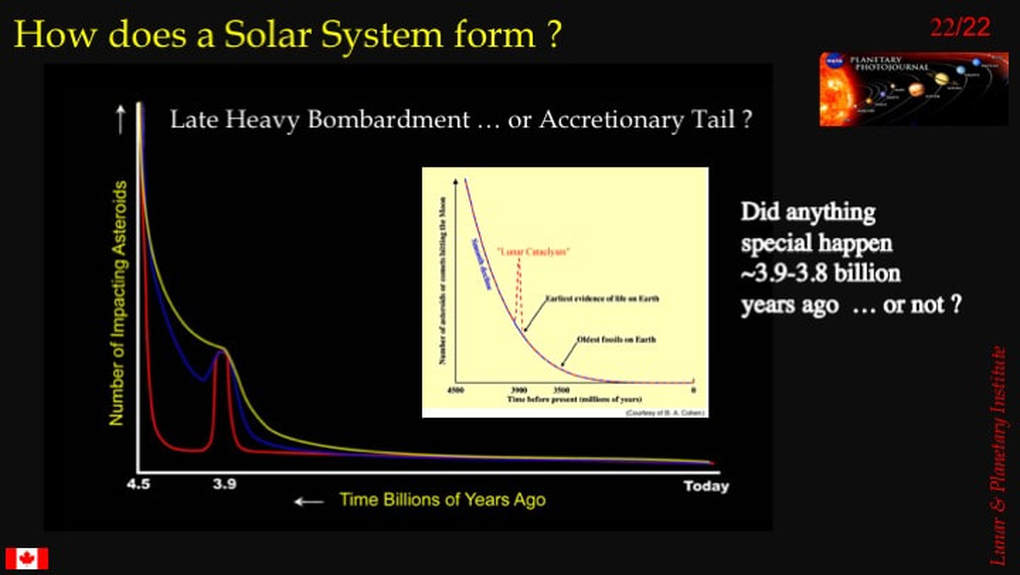
The meaning of “Heavy Bombardment” is immediately apparent to any amateur astronomer who looks at the surface of the Moon, or to anyone looking at internet images of the surfaces of Mercury or Mars - or some of the ice moons such as Callisto or Ganymede. But why “Late” ? : because the standard model requires that the Heavy Bombardment occurred at ~3.8-3.9 Ga, based on the radiometric dating of lunar samples returned by the Apollo astronauts. The Nice / Grand Tack model can be fine tuned such that interaction with the Kuiper Belt is delayed so as to provide a Heavy Bombardment mechanism at ~3.8-3.9 Ga. However, therein lies the “headache” : the model starts at ~4.6 Ga. So, why the delay of more than 600 My before the Nice / Grand Tack model kicks off the Late Heavy Bombardment ? It began to look like special pleading - and that makes scientists very uncomfortable. Accordingly, the most recent Solar System questions being asked by planetary scientists can be summarised as : “How do we know there was ever a cataclysmic bombardment, and why did it have to happen at ~3.8-3.9 Ga ?” and “What if the heavy bombardment occurred closer to the beginning of the Solar System … and simply tailed off after ~4.5 Ga ?”
The meaning of “Heavy Bombardment” is immediately apparent to any amateur astronomer who looks at the surface of the Moon, or to anyone looking at internet images of the surfaces of Mercury or Mars - or some of the ice moons such as Callisto or Ganymede. But why “Late” ? : because the standard model requires that the Heavy Bombardment occurred at ~3.8-3.9 Ga, based on the radiometric dating of lunar samples returned by the Apollo astronauts. The Nice / Grand Tack model can be fine tuned such that interaction with the Kuiper Belt is delayed so as to provide a Heavy Bombardment mechanism at ~3.8-3.9 Ga. However, therein lies the “headache” : the model starts at ~4.6 Ga. So, why the delay of more than 600 My before the Nice / Grand Tack model kicks off the Late Heavy Bombardment ? It began to look like special pleading - and that makes scientists very uncomfortable. Accordingly, the most recent Solar System questions being asked by planetary scientists can be summarised as : “How do we know there was ever a cataclysmic bombardment, and why did it have to happen at ~3.8-3.9 Ga ?” and “What if the heavy bombardment occurred closer to the beginning of the Solar System … and simply tailed off after ~4.5 Ga ?”
Let’s now turn to what exactly the Nice / Grand Tack model predicts and how it does it, then let’s look at the issue of timing and its consequences for our understanding of the Solar System as a whole. However, before we go there : a word of warning. Astrophysicists have been working on mathematical simulation models of the early history of the Solar System for a long time, and even without getting into the evolution of the models, the justifications for the model parameters have become somewhat complex. So, it will come as no surprise that I’m going to gloss over some of the details and focus on getting the big picture across here.
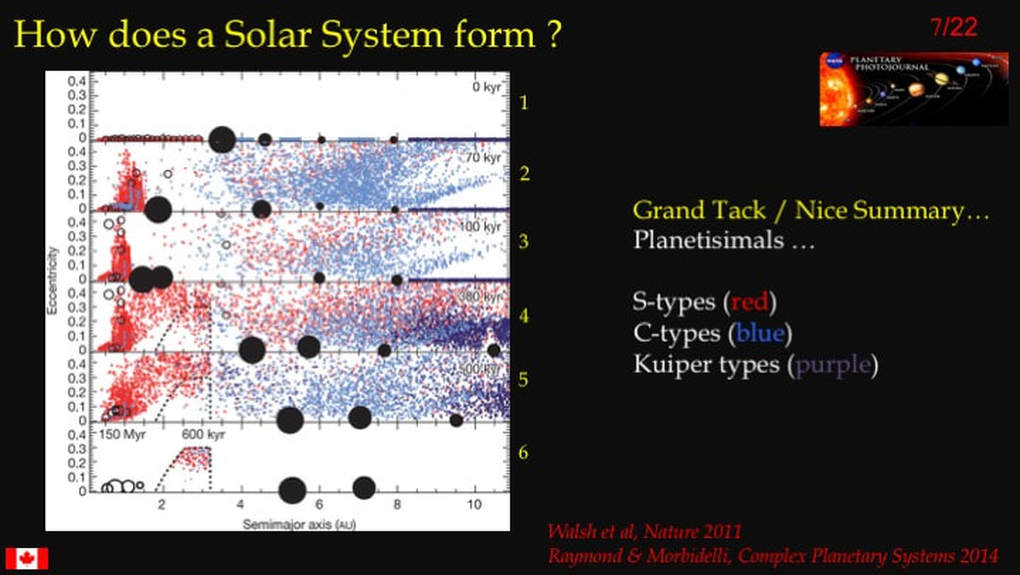
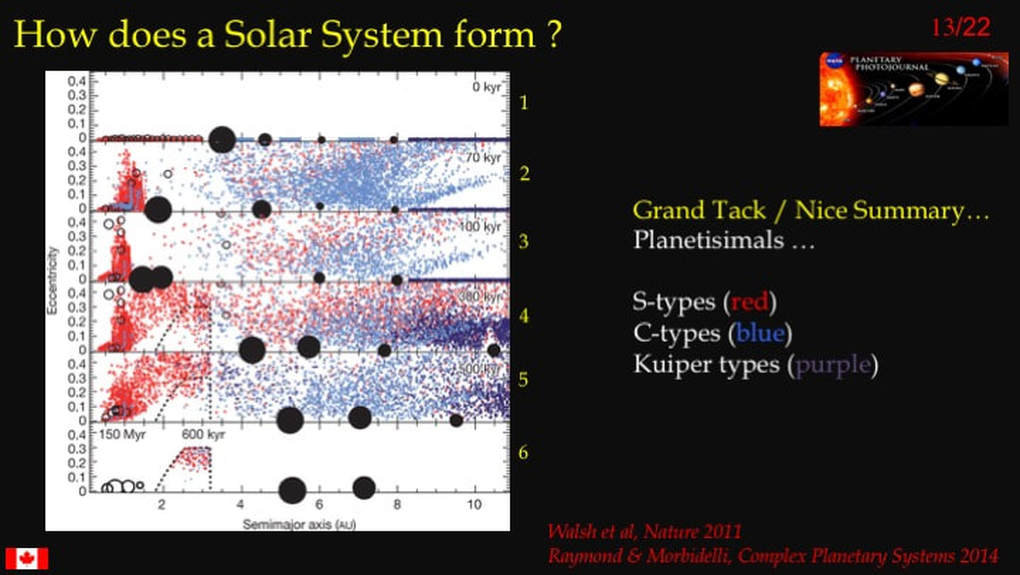
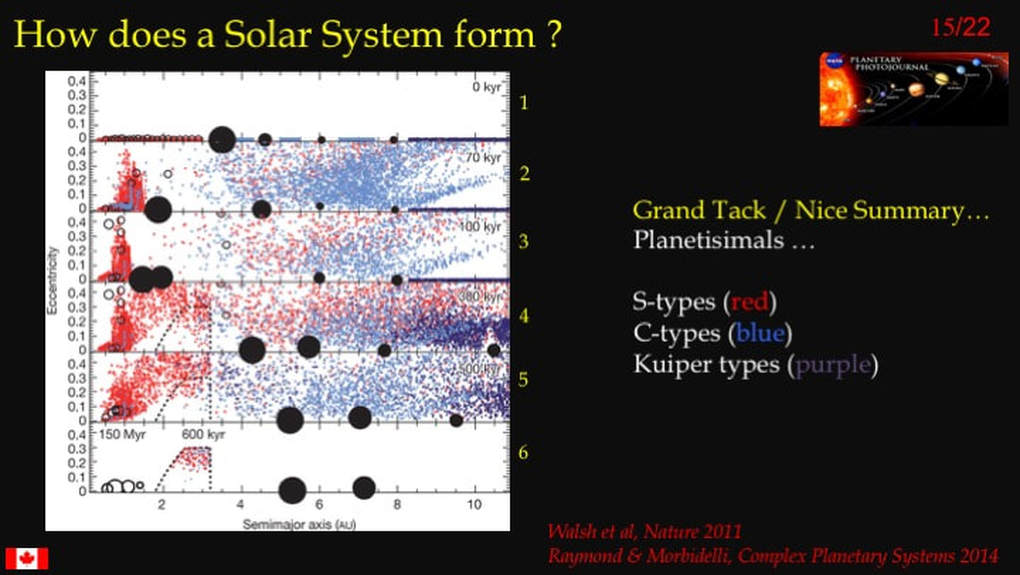
This summary diagram for the Nice / Grand Tack model looks busy, but in fact it’s pretty easy to follow. It’s made of 6 horizontal blocks, corresponding to time-slices. The first 5 blocks represent time from 0-500 ka. Yes, a model that spans 0.5 Myrs is being used to explain a sequence of events that took ~600 Myrs : more on this later. The left side of each block is closest to the Sun and as you move to the right you move outwards in AUs. The black circles are the 4 giant planets, with Jupiter sitting to the left of the others. Take a careful look and you’ll see that the black circles change in size due to accretion of gas and ice as we move through time : downwards in the diagram. The model starts in box #1 at time = zero. So, let’s take a look at the starting configuration. Inboard (left) of Jupiter we see a red stripe : this represents planetisimals (think asteroids of all sizes) that we would classify as ordinary chondrite material (S-type). Outboard (right) of Jupiter are blue stripes representing planetisimals that we would classify as primitive carbonaceous chondrite (C-type). Note the purple material at the far right : this represents Kuiper Belt materials – likely icy comets and Pluto-like dwarf planets. Finally, notice the open circles between Jupiter and the Sun : these represent lots of planetoids that sit where the Rocky Planets we see today will eventually form. All these materials start on the same line marked 0 on the vertical scale. Since the vertical scale represents orbital eccentricity, 0 indicates a circular orbit for every element in the model. Why this starting configuration ? Because they have to start somewhere : obviously we have no idea what the initial orbits of real planetismals looked like ! Something is missing from this diagram : orbital inclination ! It is in the calculated model, but it’s too complicated to include in this particular summary diagram. Now, let’s start the model and move to box – or time-slice - #2. After only 70 ky we already see major changes. First, we see that Jupiter has migrated in towards the Sun, leaving the other giant planets behind. Second, Saturn is beginning to grow at this time, but significantly more slowly than Jupiter had already done. Third, we now see a great scattering of the orbital eccentricities of the S- and C-type planetisimals, which also means that their orbits are disturbed into elliptical shapes. Fourth, notice how the S-type planetisimals are highly perturbed between Jupiter and the Sun, and some have been gravitationally flung into new orbits outboard (right) of Jupiter. Finally, notice how the Kuiper Belt remains totally undisturbed by all these goings on.
If we now move on to the 100 ky time-slice (#3), we see that Saturn has grown rapidly to full size, migrated in towards the Sun, and caught up with Jupiter. We also see that the mixing of S- and C-type planetisimals is progressing apace.
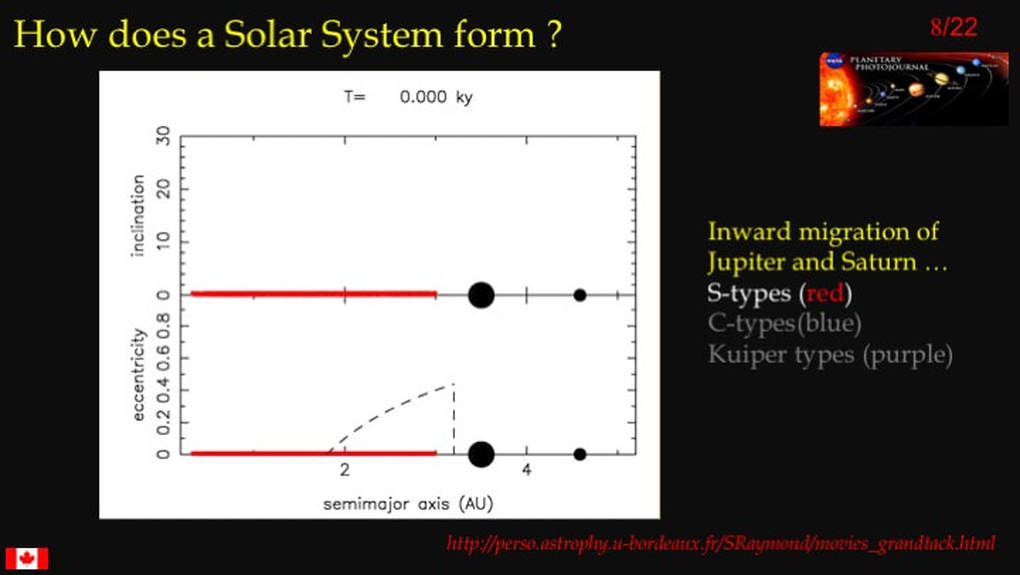
To find and run this animation go to http://perso.astrophy.u-bordeaux.fr/SRaymond/movies_grandtack.html and scroll down to this image : click on the image to download, then run the animation.
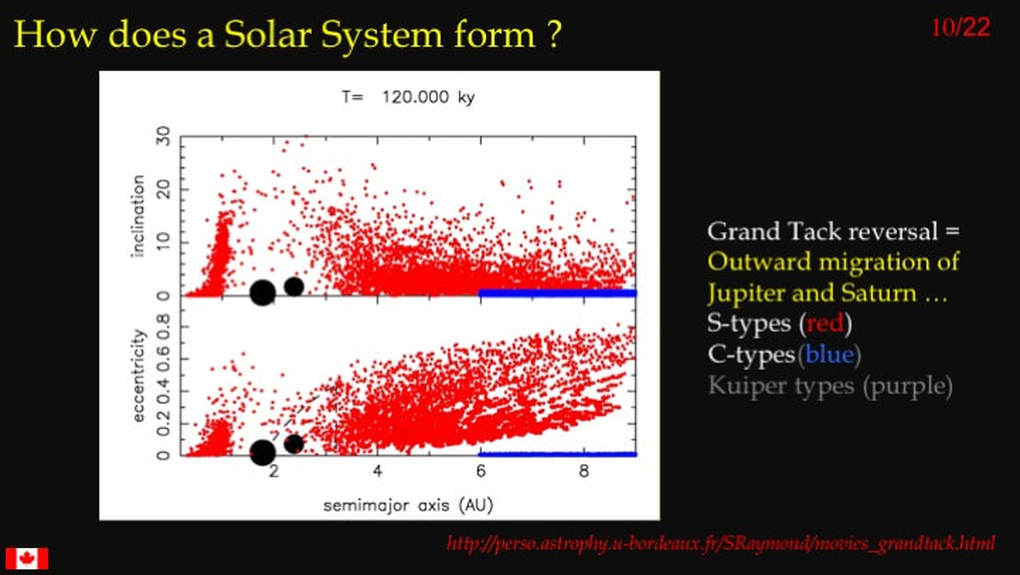
This movie zooms in on the innermost part of the model and shows what happens during the first 100 ka to the S-type planetismals that were originally all confined to the Sunward side of Jupiter. Here we see Jupiter and Saturn, with the Sun (not shown) to the left. We also see that the vertical scale will give us both orbital eccentricity and orbital inclination. Don’t worry about the dashed box for now, it represents the present-day position of the Main Asteroid Belt. The animation shows that Jupiter and Saturn migrate towards the Sun, Saturn catches up to Jupiter, the orbits of the planetismals are thoroughly disturbed in 3D - and many planetisimals are gravitationally flung toward the outer Solar System.
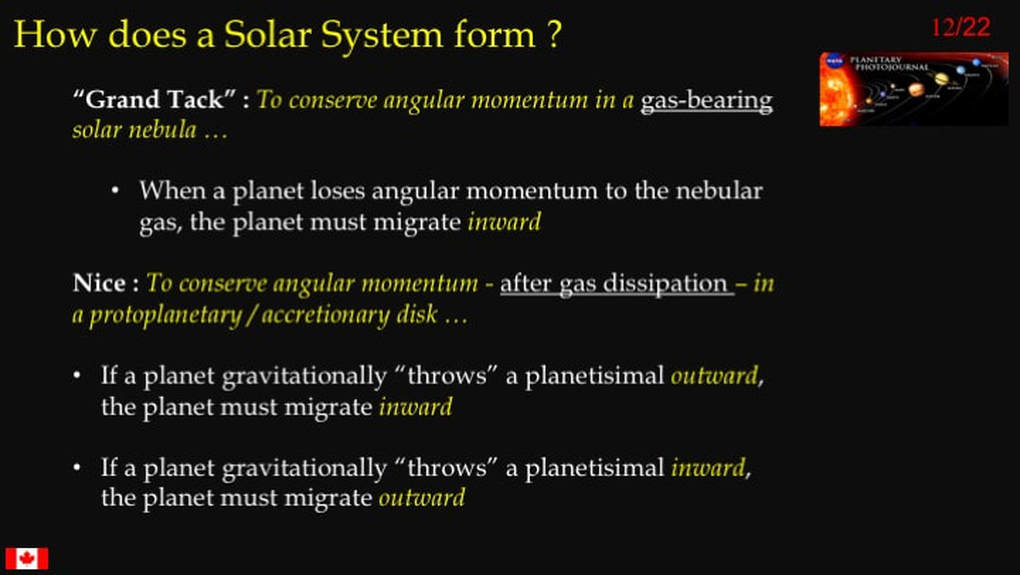
What is driving the inward migration of Jupiter and Saturn? To put it simply, the Giant Planets exchange angular momentum with the gas of the solar nebula … and that is what causes them to migrate inward towards the Sun.
What the preceding movie covered was the goings-on in the inner Solar System from time-slices #1-#3. By time-slice #4 - at 300 ky – things have changed dramatically. The mixing of the planetisimals is now more thorough, although there are still more reds to the Sunward side and more blues to the outward side. However, the big change is the migration direction of the Jupiter-Saturn pair, plus the outward migration of the now fully grown Uranus and Neptune that stirs up the Kuiper belt material. What’s illustrated in this time-slice can either be seen as the end of the Grand Tack … or the initial conditions for the Nice component of the model.
To find and run this animation go to http://perso.astrophy.u-bordeaux.fr/SRaymond/movies_grandtack.html and scroll down to this image : click on the image to download, then run the animation.
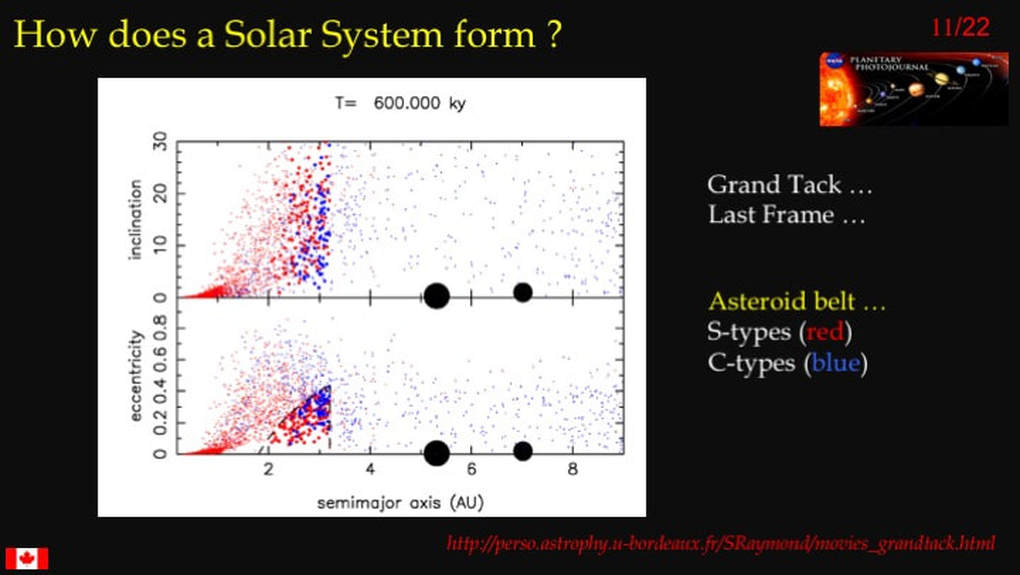
This movie zooms in on the inner part of the of this time-slice and shows what happens between 100-600 ka to the S- and C-type planetismals. Again, we see Jupiter and Saturn, with the Sun (not shown) to the left – and the vertical scale giving us both orbital eccentricity and orbital inclination. However, this time we do want to pay attention to the dashed zone marking the Main Asteroid Belt : it's going to tell us something very useful. The mixing of the S- and C-type planetismals is now pretty clear : however, can you see the compositional zonation in the Main Asteroid Belt ? This animation covered the inner Solar System in time-slice #4 : the transition from the Grand Tack component to the Nice model.
This movie zooms in on the inner part of the of this time-slice and shows what happens between 100-600 ka to the S- and C-type planetismals. Again, we see Jupiter and Saturn, with the Sun (not shown) to the left – and the vertical scale giving us both orbital eccentricity and orbital inclination. However, this time we do want to pay attention to the dashed zone marking the Main Asteroid Belt : it's going to tell us something very useful. The mixing of the S- and C-type planetismals is now pretty clear : however, can you see the compositional zonation in the Main Asteroid Belt ? This animation covered the inner Solar System in time-slice #4 : the transition from the Grand Tack component to the Nice model.
Here’s a blow-up of the last frame of the movie that emphasises the dots representing materials in the asteroid belt : the compositional zonation is unambiguous.
Why do astrophysicists insist on separating the Grand Tack from the Nice component ? Because the driving mechanisms are so different. The inward migration in the Grand Tack is driven by interaction between the Giant Planets and the gas of the solar nebula. However, the outward migration is driven by orbital resonances both between the Giant Planets and between them and the remaining planetisimals left in the Solar System System after the gas has dissipated.
In time-slice #5 – at 500 ky – the giant planets have now reached their modern distances from the Sun, and the planetisimals have reached their ultimate degree of mixing mixing : the Nice model is approaching a climax. Look carefully at the planetisimals. Notice how some of the Kuiper Belt material has now been gravitationally flung into the inner part of the Solar System, and the tendency for S-type asteroids to predominate in the inner Asteroid Belt, and for C-type material to predominate in the outer Asteroid Belt – is visible even in this summary diagram. What about time-slice #6 ? – a jump forward to 150 Myr . What is it doing here ? Basically it just illustrates that after all the dust has settled – pun intended BTW – we see the modern configuration of the Solar System with 4 Rocky Planets, a zoned asteroid belt, plus Jupiter and Saturn.
To find and run this animation go to http://perso.astrophy.u-bordeaux.fr/SRaymond/movies_grandtack.html and scroll down to this image : click on the image to download, then run the animation.
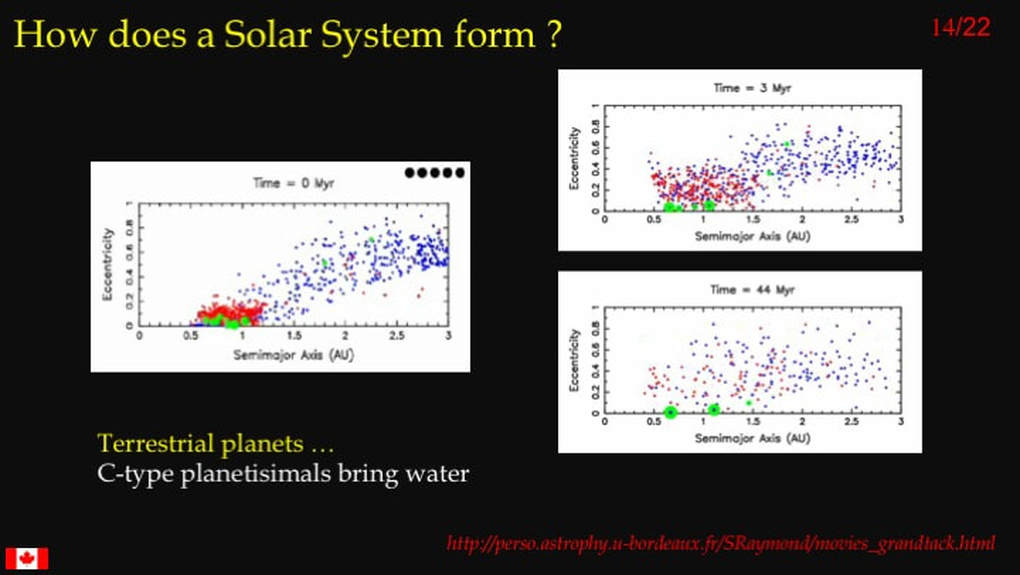
I mentioned water earlier. The heat of accretion coupled with the heat from radioactive decay – especially of the very short-lived isotope Al26 – led Rocky Planets to melt and differentiate, which would have driven off any primordial water. So the question of where water came from on Rocky Planets was a point of much debate prior to the Nice / Grand Tack model. This image illustrates how the Nice / Grand Tack model proposes that – during the mixing of S- and C-type planetisimals - the carbonaceous chondrites (blue) from the outer Solar System brought water to the inner Solar System where it accreted to the Rocky Planets (green). The movie runs for 150 Myrs, while the two panels to the right at 3 Myrs and 44 Myrs represent snapshots. Note how blue dots appear and grow within the green circles, representing successful accretion of carbonaceous chondrites and their water content.
I mentioned water earlier. The heat of accretion coupled with the heat from radioactive decay – especially of the very short-lived isotope Al26 – led Rocky Planets to melt and differentiate, which would have driven off any primordial water. So the question of where water came from on Rocky Planets was a point of much debate prior to the Nice / Grand Tack model. This image illustrates how the Nice / Grand Tack model proposes that – during the mixing of S- and C-type planetisimals - the carbonaceous chondrites (blue) from the outer Solar System brought water to the inner Solar System where it accreted to the Rocky Planets (green). The movie runs for 150 Myrs, while the two panels to the right at 3 Myrs and 44 Myrs represent snapshots. Note how blue dots appear and grow within the green circles, representing successful accretion of carbonaceous chondrites and their water content.
So -how do we pack 600 Myrs of Solar System evolution into a 0.5 Myr model ? No-one’s sure, and that’s a very major headache ! So, having looked at the how of the Nice / Grand Tack model, maybe we should now look at what planetary scientists are saying about the when !
In December 2016 I gave a presentation at this podium regarding the recent questioning by planetary scientists of the impact history of our own Moon. https://www.simonhanmer52.ca/lunar-cataclysm.html. Up until the last decade, the standard model defined the Late Heavy Bombardment as a cataclysmic event that was dated at ~3.8-3.9 Ga using rock samples returned from the Moon by the Apollo programme.
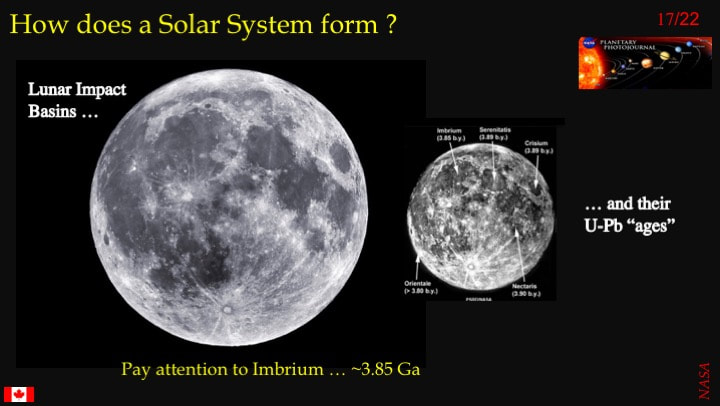
Samples interpreted to represent the events that created the major Mare Impact Basins consistently yielded what were taken to be formation ages in the range of 3.8-3.9 Ga. Hence the Late Heavy Bombardment was accepted as a Solar System-wide cataclysm. Notice the Imbrium Impact Basin (~3.85 Ga) : it is the youngest of the basalt-filled Mare basins on the Moon’s near-side. Keep it in mind …
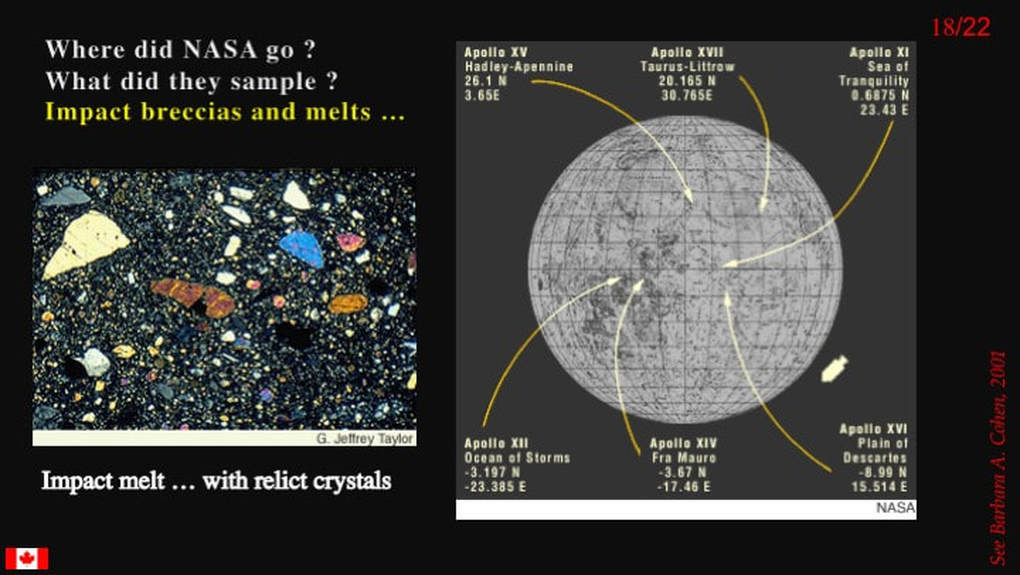
NASA’s Apollo rock samples – principally impact breccias (rock crushed by the force of impact) and impact melts (rock melted by the heat of impact) - all came from a relatively limited part of the Moon’s surface.
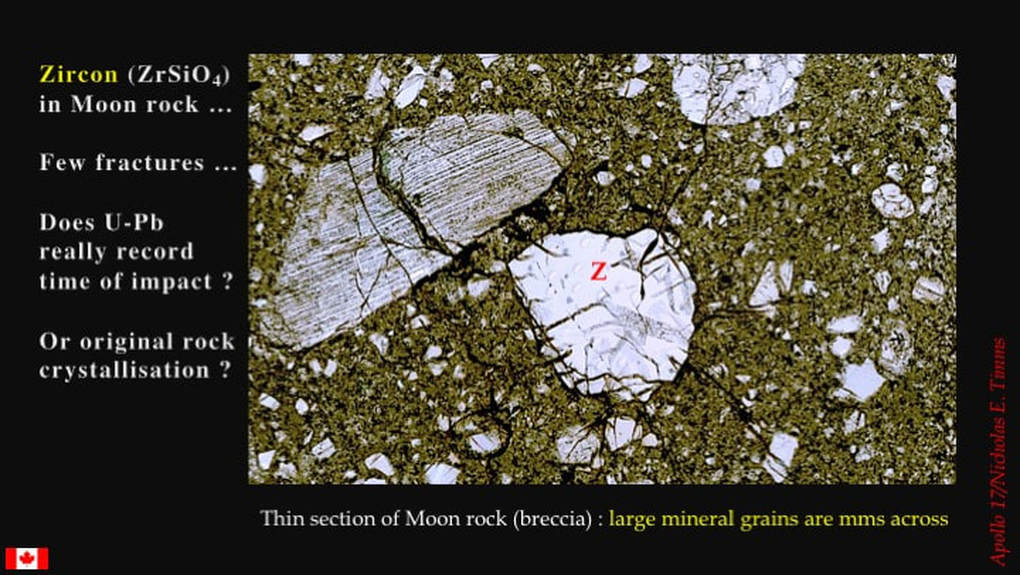
In the 1970s, scientists used two principal methods to obtain ages of impact basin formation. The first looked at the U/Pb radioactive decay process in grains of a mineral called zircon. The problem was that they used an old method of dissolving all of the grain in acid prior to analysing the U and Pb content. We now know that zircon can have complex microstructure with internal domains and external rims - each of which can represent distinct new growth and/or resetting of the U/Pb clock. Analysing the whole grain in this manner can give mixed or meaningless numbers.
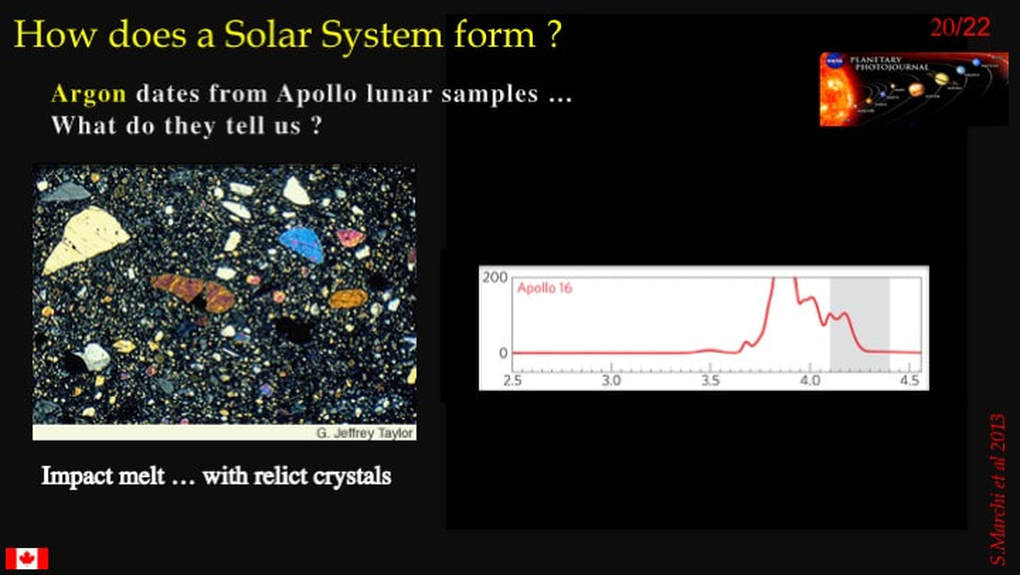
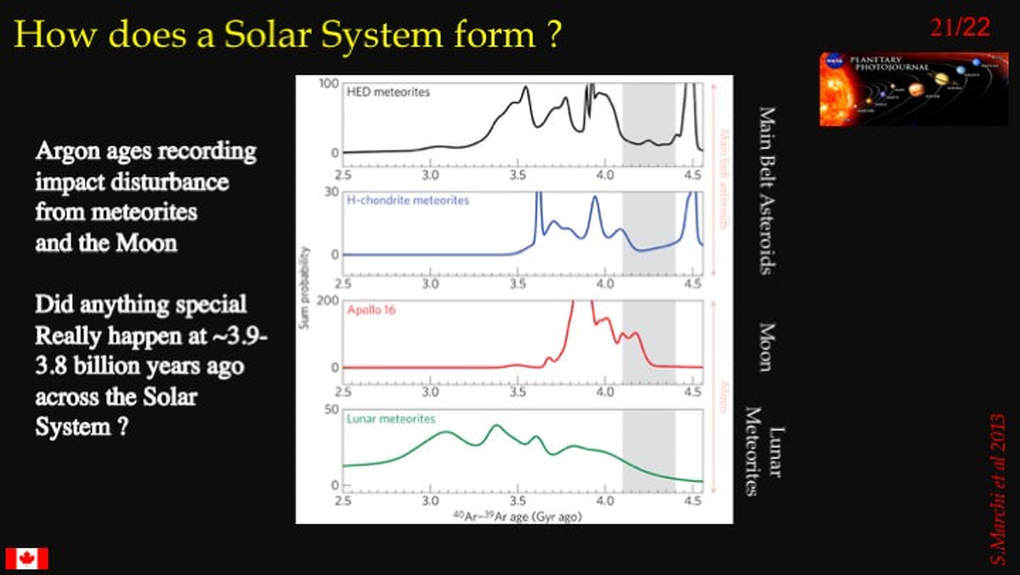
One way of getting around this problem was to analyse the isotopes of Ar in impact melts. When they did this, they obtained a spike in ages at ~3.8-3.9 Ga – implying that something major happened on the Moon at that time.
However, when they looked at the Ar isotopes of meteorites from across the Solar System, including lunar meteorites that had come from all over the Moon … the ~3.8-3.9 Ga signature vanished - except for the Apollo samples. Scientists quickly realised what had likely happened : it looked like the radioactive clocks in all of the Apollo samples had been reset by the youngest Mare Impact Basin event at ~3.85 Ga : the event that formed Imbrium.
So - where does all this leave us ? What are our take-home messages regarding the first half a billion years of Solar System history ? My first take-home message is that the Nice / Grand Tack model may be better calibrated to what really happened than first appears. We now realise that a cataclysmic bombardment event at ~3.8-3.9 Ga is highly improbable. If there ever was such an event, it occurred much earlier than that. In fact, it may have occurred so early that it’s indistinguishable from the beginning of accretion itself, which would be the case if the Nice / Grand Tack model really does represent the first 500 ka of Solar System history. However, then there would be no reason to invoke a “Late Heavy Bombardment” at all … of any age. Rather, initial rapid accretion would have gradually slowed as a tailing off – referred to technically as an Accretionary Tail.
However, as always, there are other ways of looking at things. Perhaps there was a Late Heavy Bombardment as predicted by the Nice / Grand Tack model : it just occurred earlier than we think – at some unspecified time before ~4.0 Ga. Alternatively, there was indeed an overall Accretionary Tail onto which Nice / Grand Tack processes grafted more of an uptick in impact events, as opposed to a Late Heavy Bombardment. Right now, everything is on the table.
My second take-home message is that, whether or not a Late Heavy Bombardment occurred, the Nice / Grand Tack model is still considered by most – but not all -planetary scientists to provide the best explanation to date for so many other aspects of the overall nature of the Solar System.
Finally, the third take-home message is that – until quite recently – planetary scientists thought we had a yard-stick by which to correlate events on the surfaces of most solid objects in the Solar System. However, without a Late Heavy Bombardment, that yard-stick disappears. Even with a Late Heavy Bombardment, they now realise that if it really happened, they don’t know when – and they don’t know how strong it might have been. So they don’t know how much they can attribute to it. In short … everything currently seems to be up for grabs.
What’s the short-term solution ? Return to the Moon and sample more globally, perform radiometric dating to exacting modern standards - and evaluate the existence of a cataclysmic event once and for all. Stay tuned : Solar System science is about to get even more interesting , even more fascinating – and as amateur astronomers, we have front-row seats.
Proudly powered by Weebly

