|
MARS EXPRESS : high-resolution images I
|
For reasons I have yet to fathom, public science organisations have an major problem with communications. For example, NASA, JAXA and ESA have scads of fabulous scientific data placed into the public domain, but fail to ensure that the public – even the interested public (us!) – knows about it. I recently “discovered” a treasure trove of high resolution images from the ESA’s Mars Express Mission – with optical resolutions in the range of 10-30m per pixel. Not only do these images contain astounding detail, they have also been rendered in 3D perspective, giving the viewer the firm impression of “being there”. This is an amazing achievement.
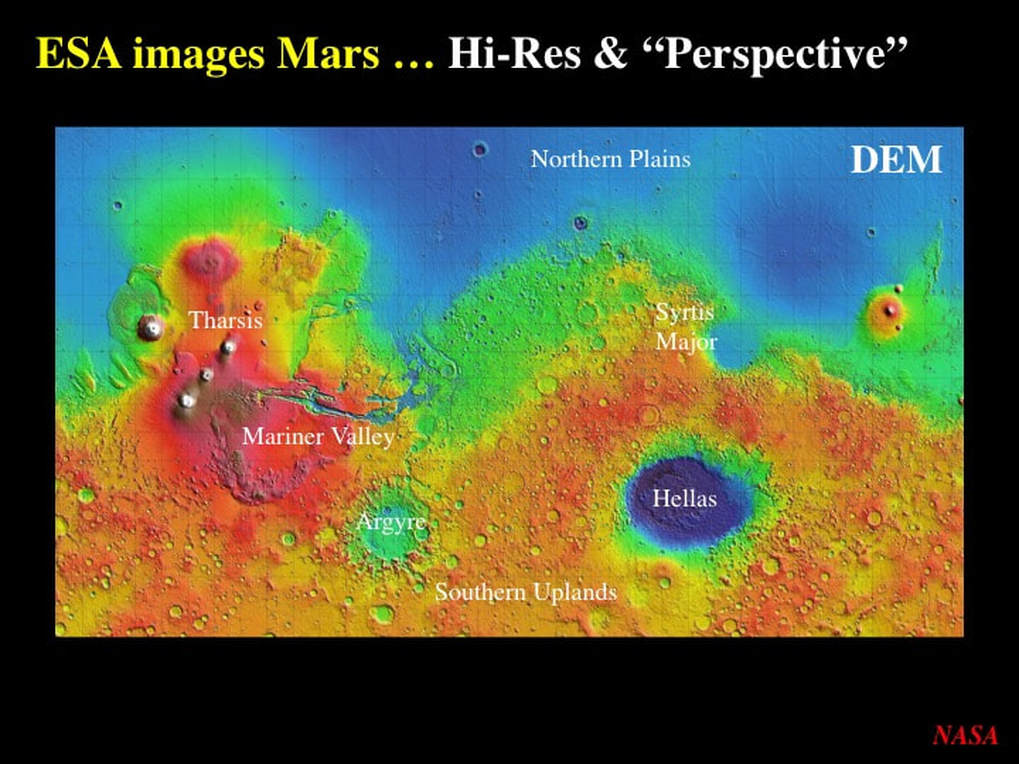
Before we get to the images, I need to point out a few things. This is a very useful topographic map of Mars produced by NASA : formally it’s referred to as a Digital Elevation Model – a DEM in the jargon. It really brings out the principal topographic features of the martian surface.
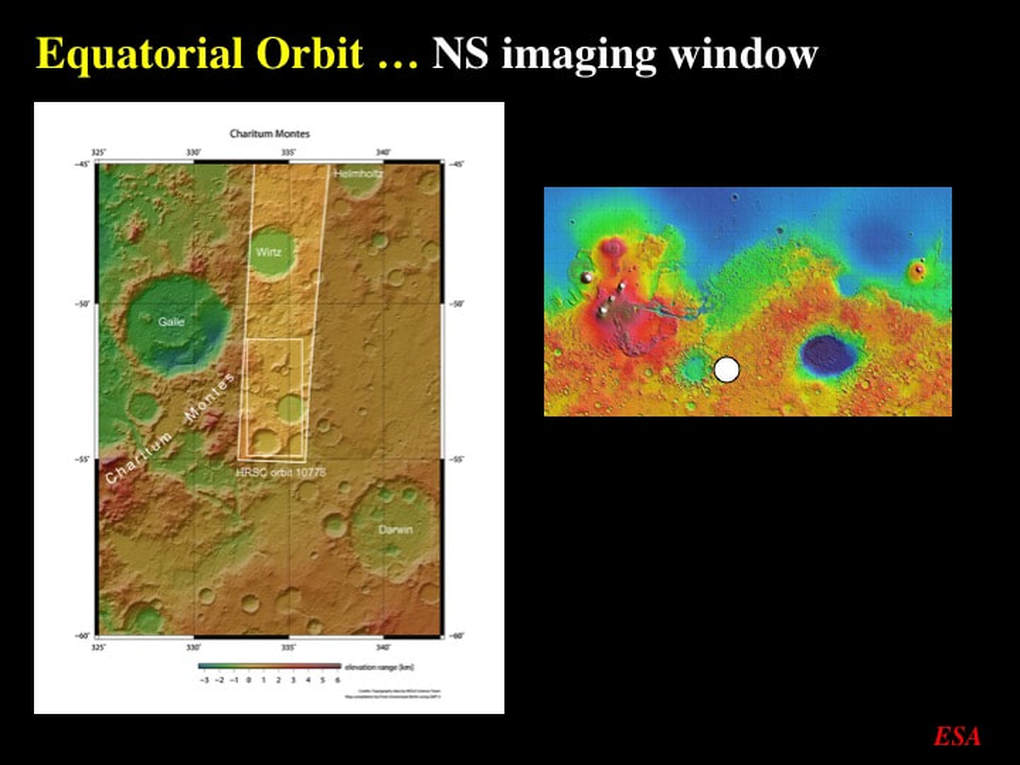
Mars Express is a satellite on a polar orbit – passing from pole to pole. As the planet turns beneath the satellite, Mars Express is able to image the entire planetary surface. So, now I need to orient you! The Mars Express images are rectangular; that is to say that they are longer in the NS direction. Unfortunately, computer screens are wider in the horizontal direction, which means that ESA has rotated all of the images such that NORTH is to the RIGHT, and that’s the case in my slides too. Note the insert on the right of this image : that’s a location map derived from the Mars DEM with a white locator dot that you will see in some of the following slides.
What I want to show you in this first of three presentations is an eclectic collection of images that illustrate how the martian planetary surface has been modified by a variety of processes over the past 4 billion years. With these images I want to ask : “What evidence can we see for the processes that shaped the topography – or the landscapes - of Mars” in the high-resolution images provided by ESA ?
What I want to show you in this first of three presentations is an eclectic collection of images that illustrate how the martian planetary surface has been modified by a variety of processes over the past 4 billion years. With these images I want to ask : “What evidence can we see for the processes that shaped the topography – or the landscapes - of Mars” in the high-resolution images provided by ESA ?
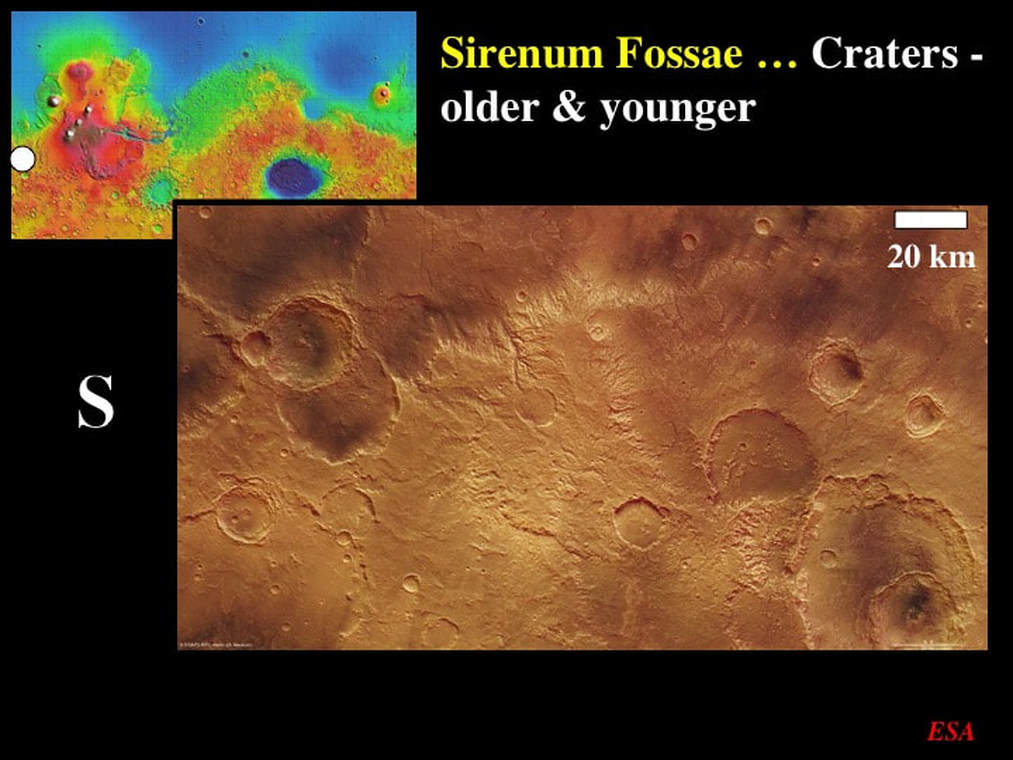
Here’s a broad overview of the Sirenum Fossae area to the West of the Tharsis Plateau – fossae means “trenches” by the way. Note the scale bar, and remember that North is to the right. Among other things, this image clearly illustrates the relative time sequence of moderately large impact cratering of the martian surface. Two sets of sequential cratering can be clearly observed in the lower right and upper left corners of the image. Older craters are either less well defined, in-filled with flat floors, partially covered by younger ejecta from later impacts, or simply overprinted by younger, better defined craters with deeper cavities and obvious collapsed terraces along their walls.
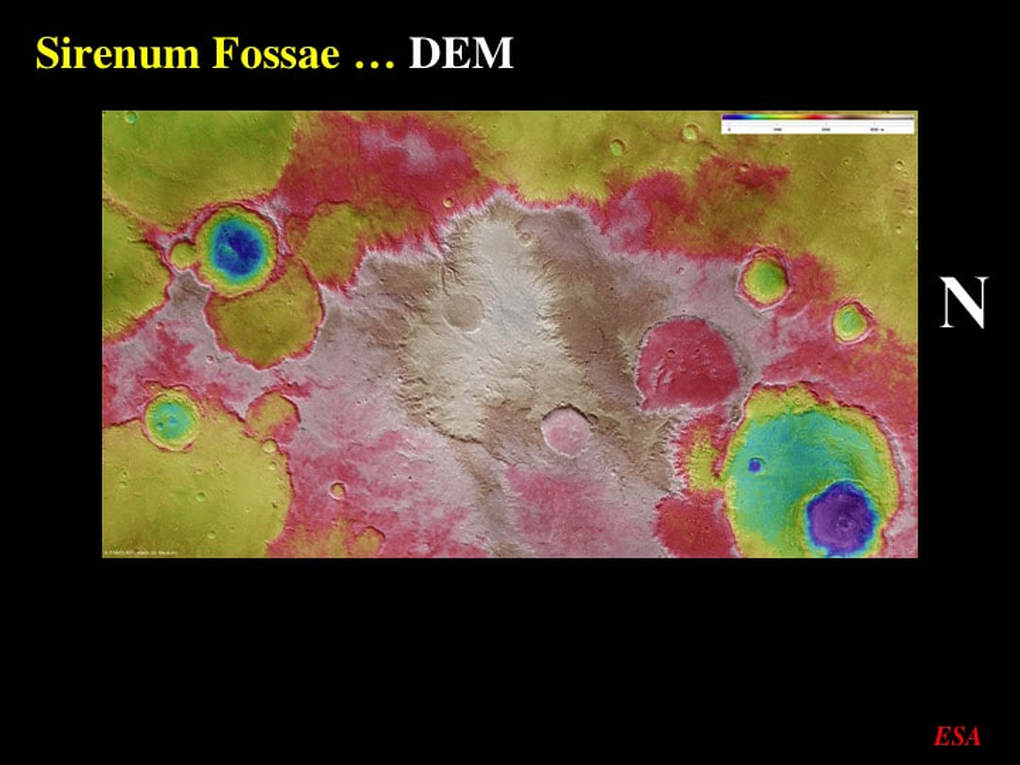
The DEM of this area not only shows the impact sequences very nicely, it also gives you a quantitative sense of the topography. Greys, browns and pinks represent the top of a plateau that has been punched through by the impacts to form lower areas in red, further punched though to form the deepest crater floors seen in green and blue. Focus for a moment on the 1-2-3 cratering sequence in the top left corner of the image.
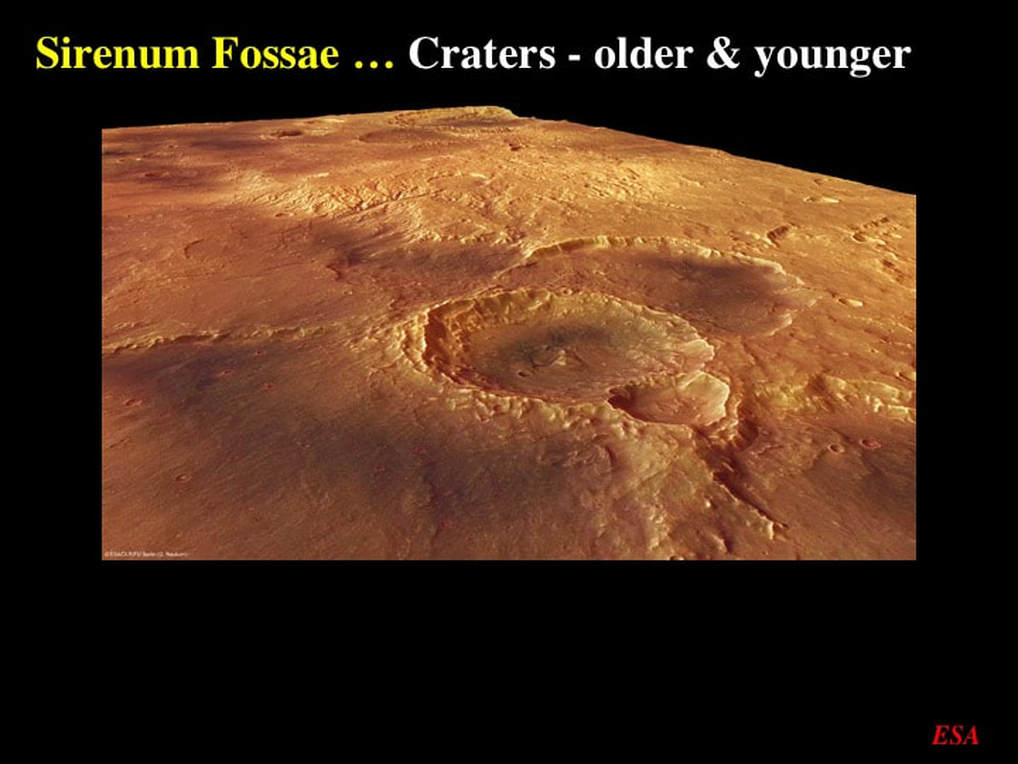
Here it is as a rendered 3D perspective image where you clearly see the oldest flat-floored crater, cut by a younger, deeper crater that preserves its central peak and its terraced walls, itself cut by a smaller crater that overprints part of the wall of the larger crater.
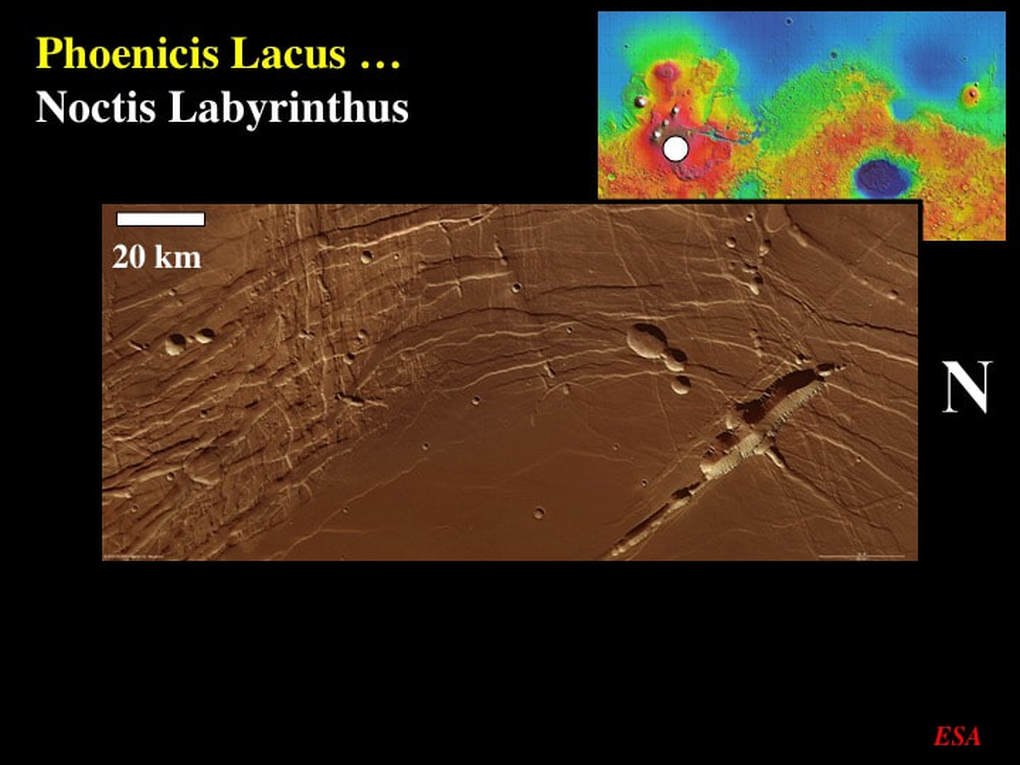
Let’s now move to Phoenicis Lacus (Phoenix Lake) at the western end of the Mariner Valley, or more precisely the southern extension of the Noctis Labyrinthus (Labyrinth of the Night). Noctis Labyrinthus is a large region of canyons that lie nearly perpendicular to each other, looking a bit like a map of city streets. There are lots of different ideas on precisely how this came about – but here’s some observational evidence. Notice the three sets of long, narrow linear features, all of which have that tell-tale “skinny” rift valley appearance (and note the scale bar). I’ve discussed this kind of thing with you before. These “skinny rifts” represent ground collapse above vertical sheets of magma that rose from within the planet, but didn’t quite make it to the surface. Given the proximity to the Tharsis Plateau with its giant volcanoes, this is not a surprising interpretation. But look more closely : can you see the three pits aligned along a “skinny rift” ? These are typical collapse pits where the surface subsided into an underlying void created by the magma sheets. And what are we to make of the large valley in the lower right corner of the image ? How did it form ? There’s no way that a river carved out this valley – because the valley has internal transverse walls and bridges, as well as aligned pits. This valley is clearly the product of surface collapse into an underlying void related to subsurface magmatism.
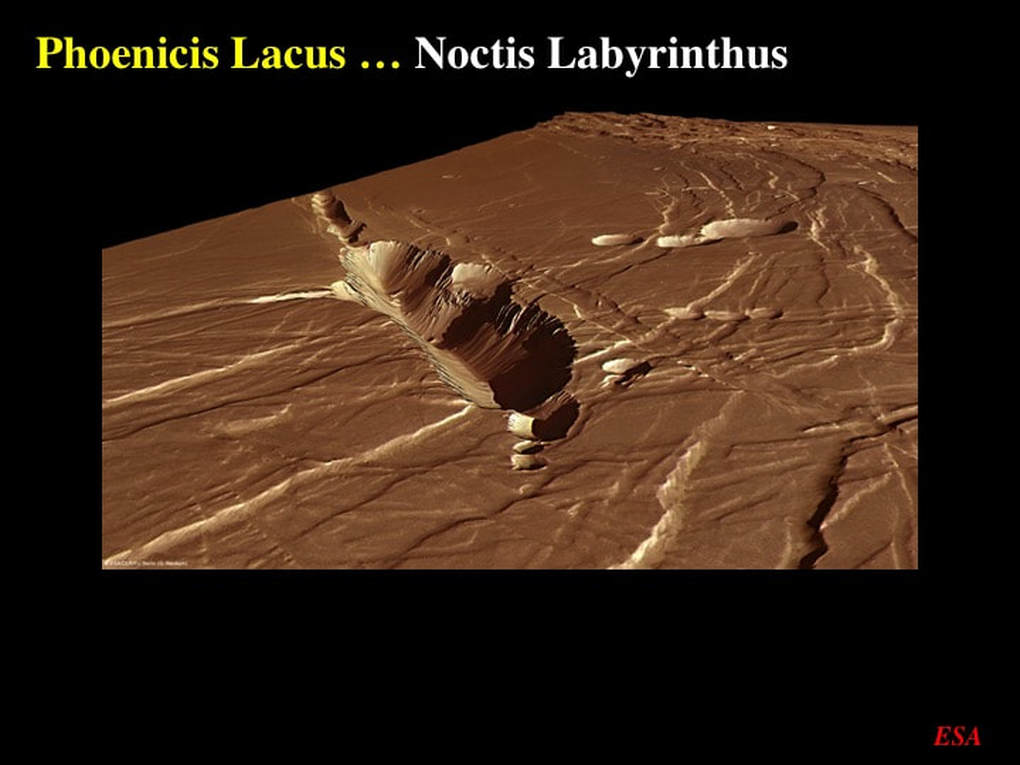
Now in this 3D perspective image we can see all of these features in stark relief : linear “skinny” rifting with collapse pits aligned along them, plus the segmented nature of the collapse valley with its internal transverse walls.
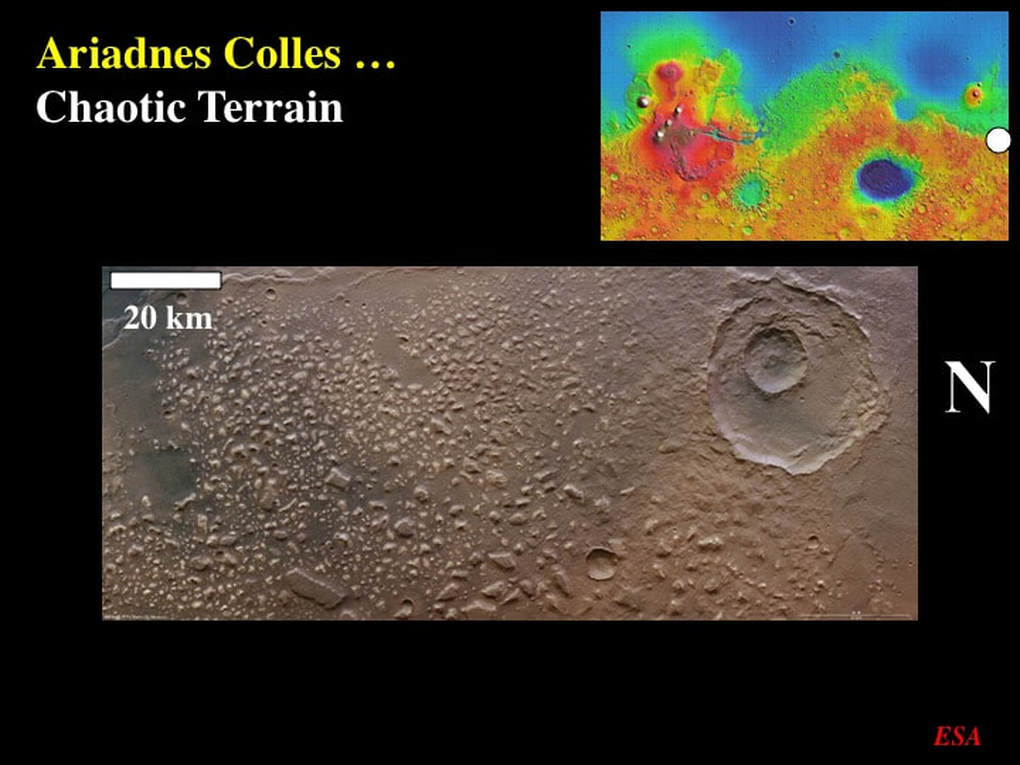
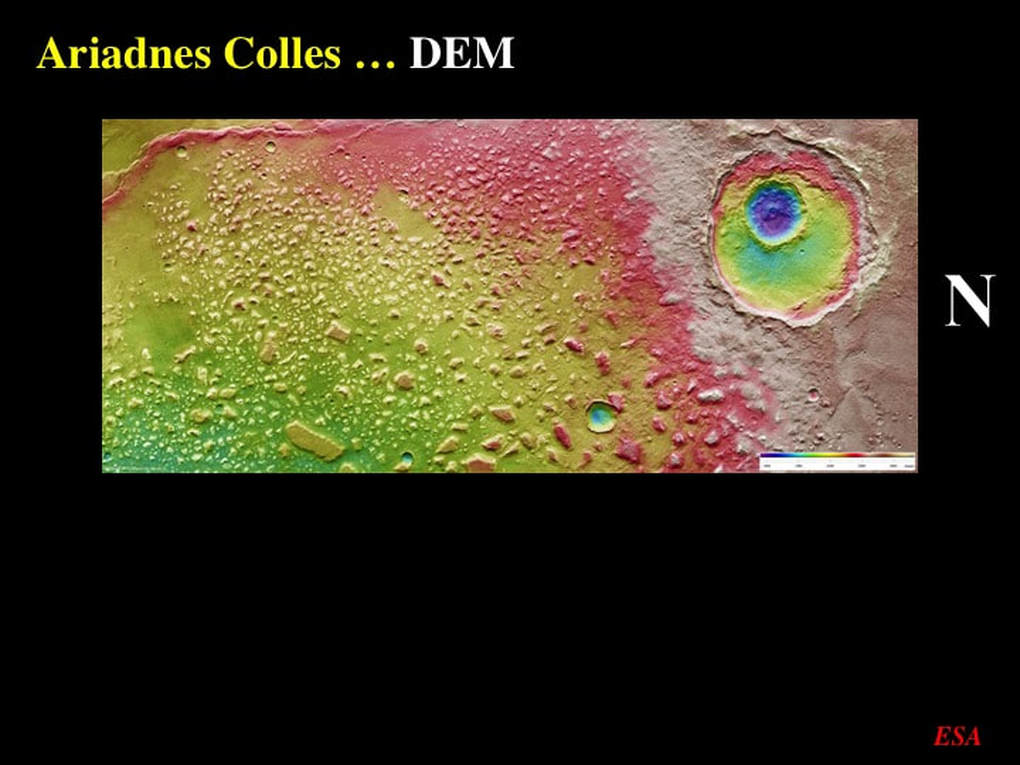
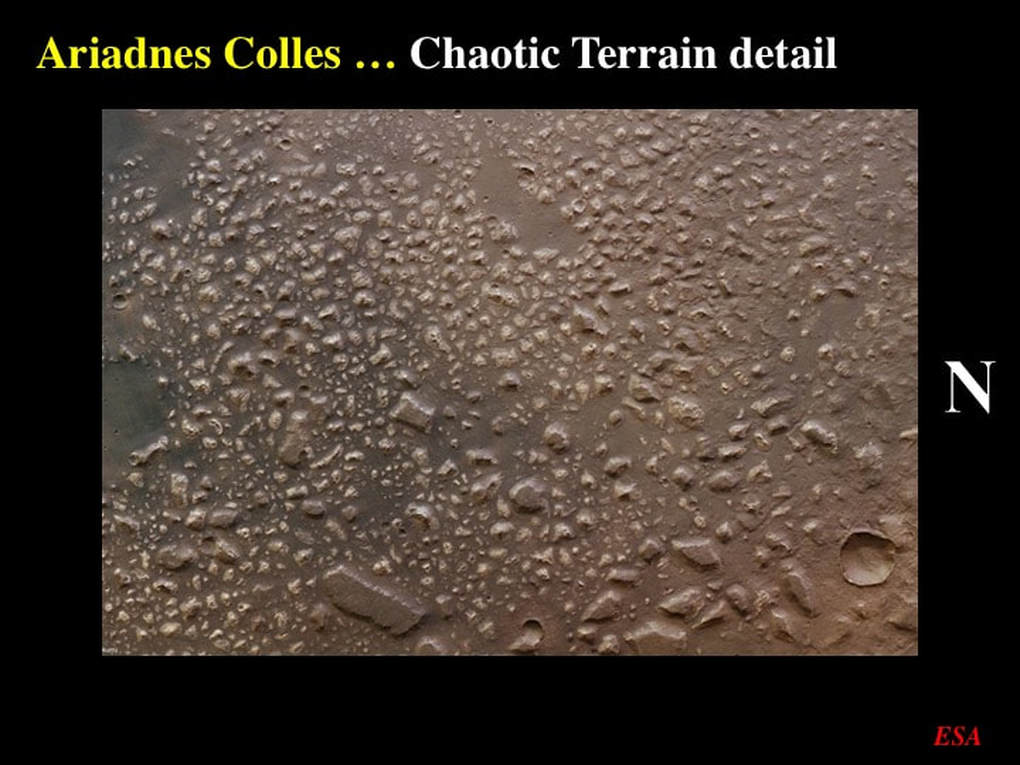
When surface collapse becomes really extensive (note the scale bar), we end up with “Chaotic Terrain”. This example comes from the boundary between the ancient southern Highlands and the somewhat younger Northern Plains. What we observe here are large, flat-topped blocks of rock that look like they were once part of an extensive plateau. Some are as long as 15km – such as the rectangular block at lower left
The DEM image of the same scene shows that the blocks are tall enough to show up in the elevation map. It also shows us that the “Chaotic Terrane” forms lower ground than the preserved plateau to the right, with its multiple, superimposed impact craters.
What happened here ? If this is another example of surface collapse, it’s not associated with arrays of linear “skinny” rifts this time. The general idea for this kind of terrain is that extensive permafrost was rapidly (perhaps catastrophically) melted and that the escaping flash floods carried away the least resistant material at depth, leading to surface collapse and leaving these large blocks behind.
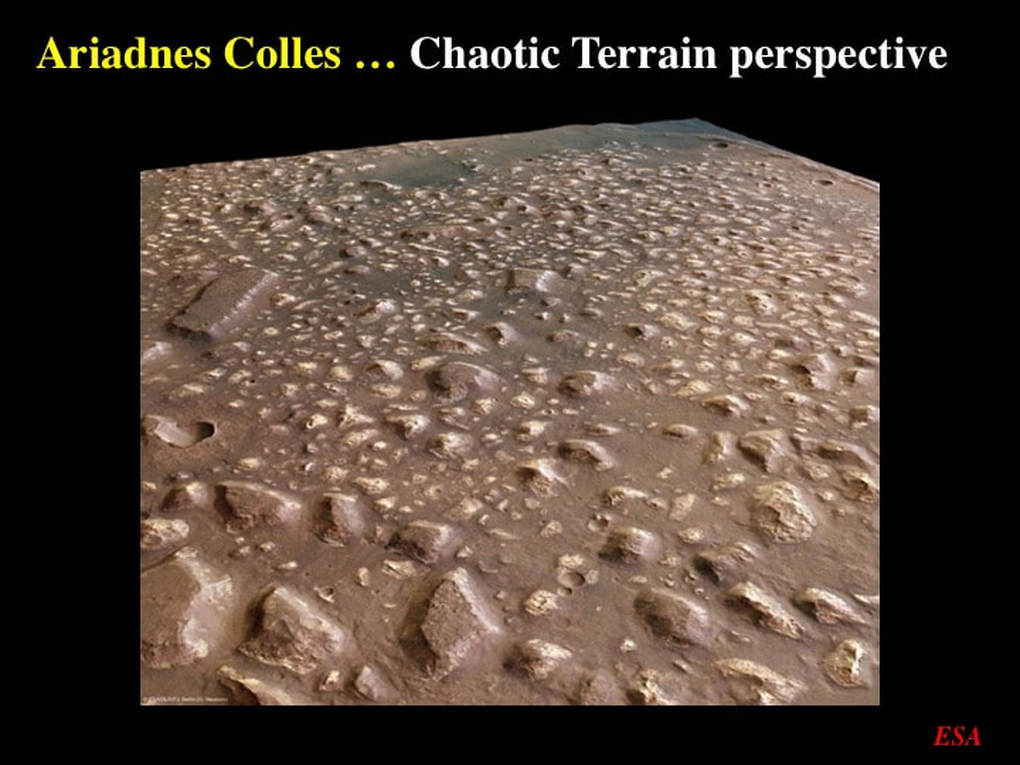
However, when we look at the same scene in 3D perspective we see that, in this particular case, the flat-topped blocks haven’t been jostled all that much : they’re still flat-topped from block to block. Perhaps in this case of “Chaotic Terrain” the flash-flood erosion occurred at or near the surface or, as suggested by ESA, this might be a case of extensive wind erosion.
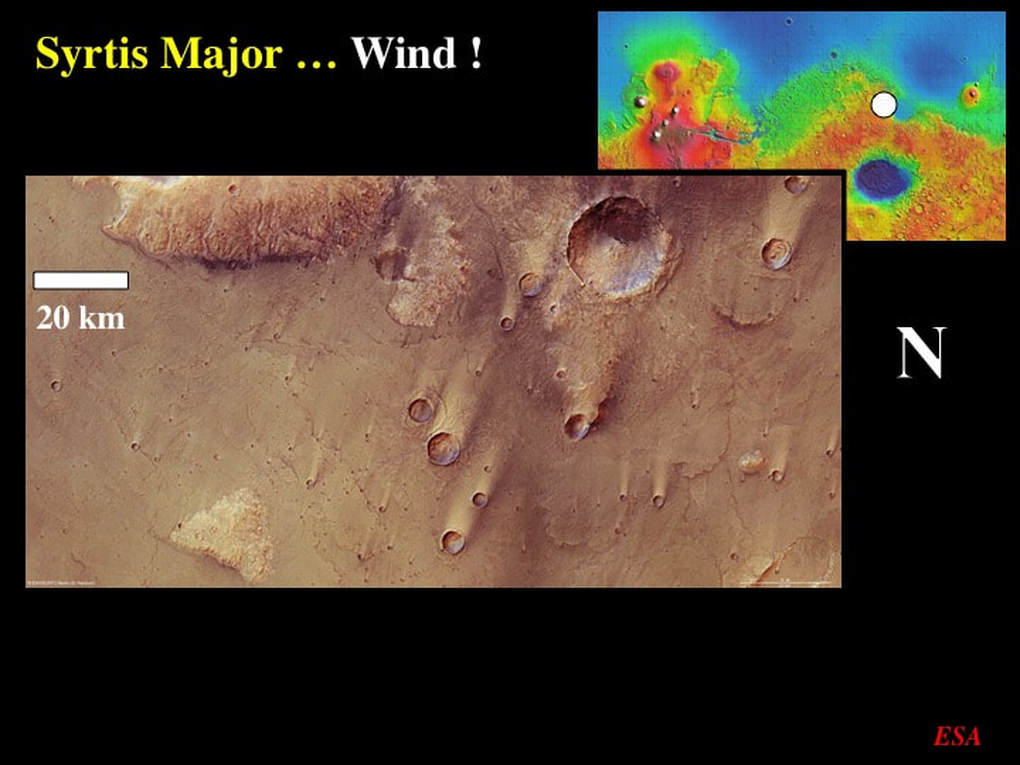
While on the subject of martian winds, this image from the eastern flank of Syrtis Major (remember, North is to the right here) shows large tails of light coloured sand ( note the scale bar) extending down-wind in the lee-sides of the rims of a set of impact craters. These tails are where the wind-blown sand was not only deposited, but where it was preserved from subsequent or contemporaneous erosion by the same winds. That’s why they are preserved on the leeward sides. The sand was eroded from everywhere else and carried away by the constantly oriented winds
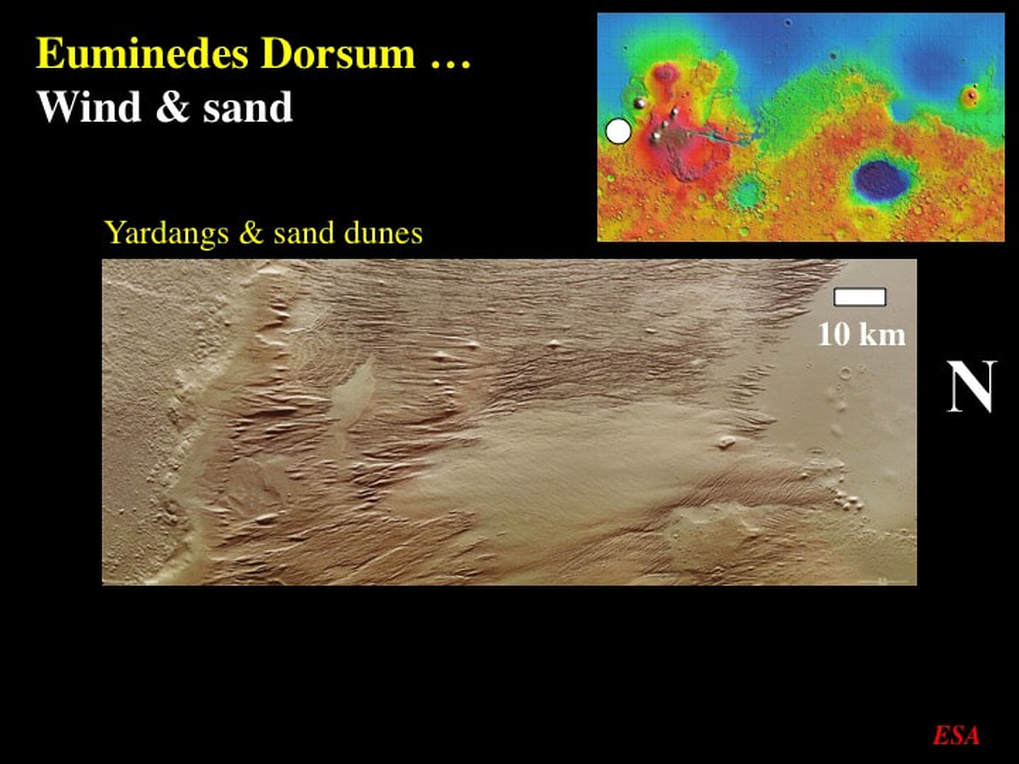
Staying with martian winds, let’s move back to the highland/lowland boundary just west of the Tharsis Plateau, where we see clear, extensive evidence (note the scale bar here) for the erosive power of wind-borne sand. First, notice the very strong N-S (right-left) grain in the solid bedrock. This is the result of sand-blasting by consistently oriented winds. The bright “lumps” are pyramid-shaped, and perfectly natural. The ridges and lumps that resisted sand-blast erosion are called “Yardangs”. The large smooth area is a field of sand dunes, deposited on top of the yardangs, and is therefore younger. Note also the curved features at top left; I’ll come back to these in a minute.
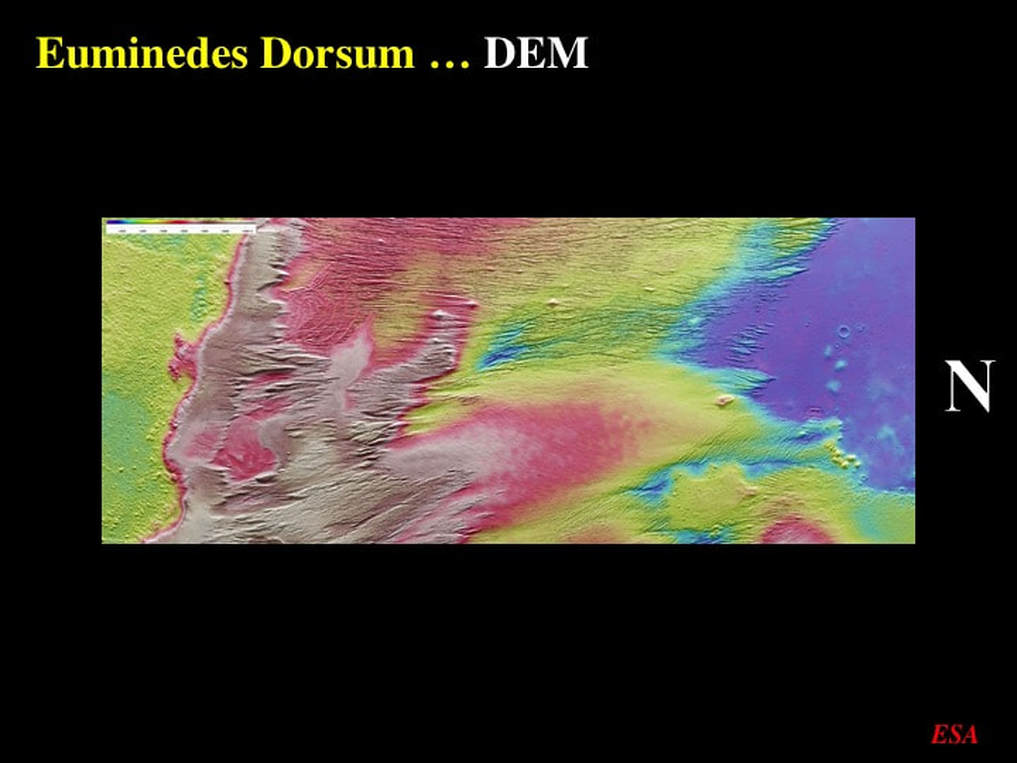
Once again, the DEM gives a quantitative element to the topography : we see that an elevated ridge to the left (South) slopes progressively down to the right (North).
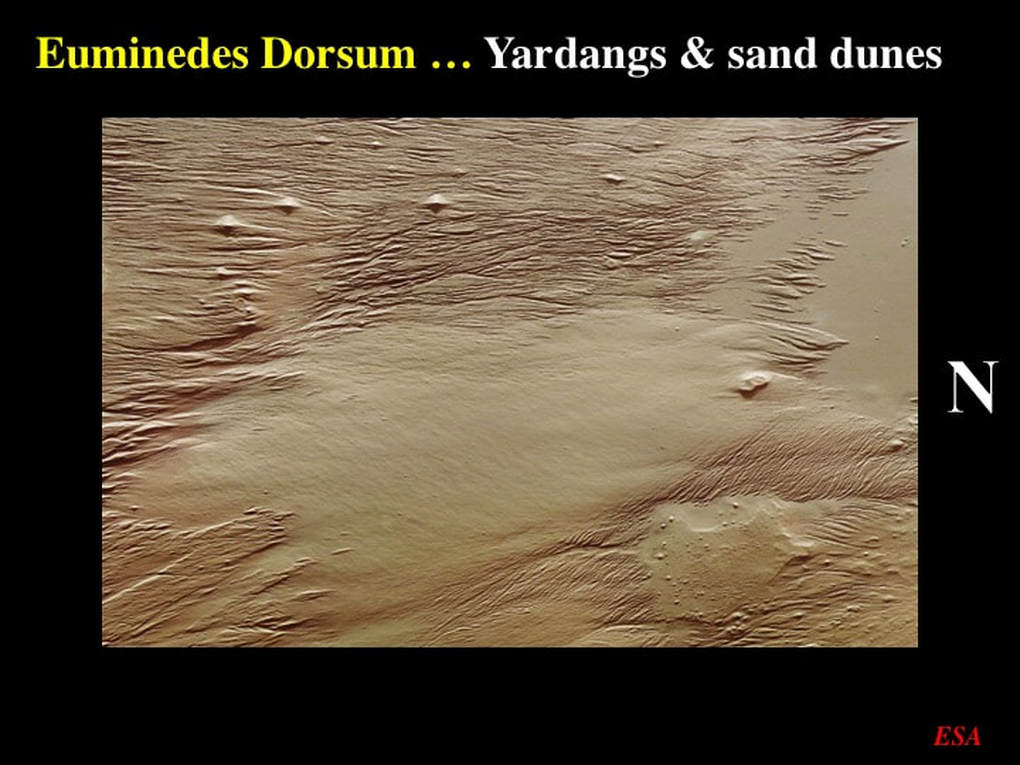
When we zoom in we can clearly see that the smooth sand dunes smother the older erosional yardangs. But look carefully : The grain of the yardangs is less consistent than first appeared : the grain is NS-oriented in the West, but NW/SE-oriented in the East. Why? Look more carefully and you will see hints of geological layering in the West that is parallel to the erosional grain in the East. Has this geological layering influenced the way the rocks eroded, whatever the wind direction ? In that case, why are the sand dune crests in mid-field oriented near-perpendicular to the yardangs in the lower right corner of the image ? Were there two wind directions that changed with time ? The point here is that even if we can’t answer these questions, these ESA images are of high enough resolution that we can ask them !
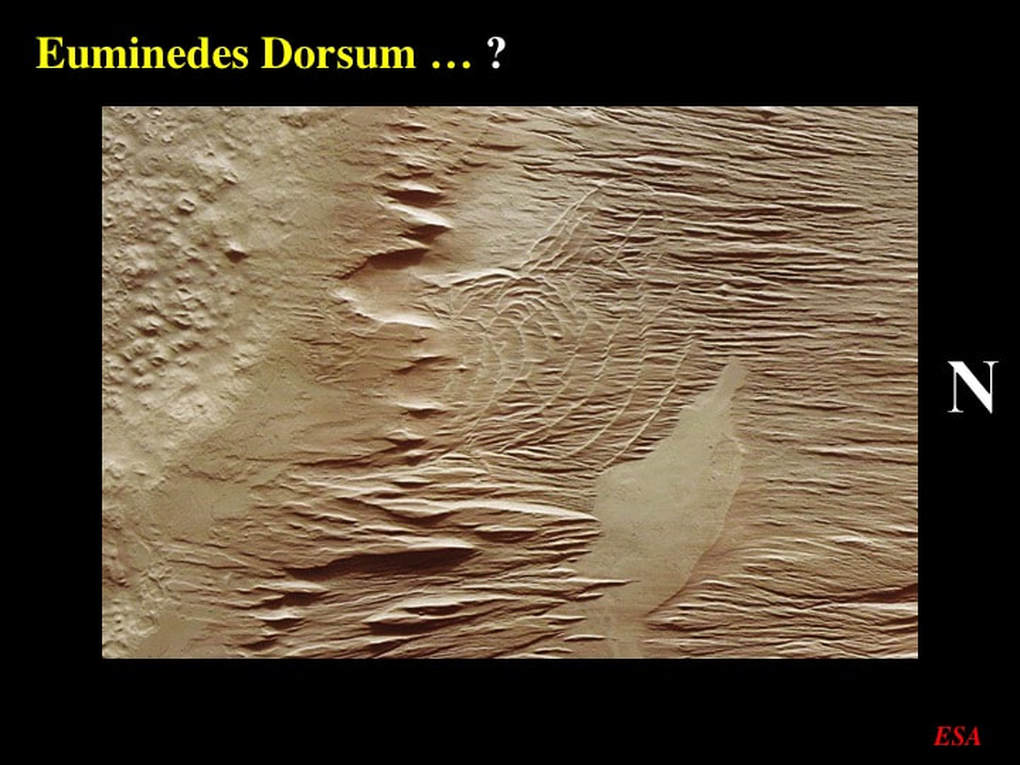
On the upper slopes of the topographic ridge we can clearly see the yardangs “eating” their way back into the ridge (left). But what are we to make of the complex curved lines that are clearly superimposed on – and therefore younger than – the erosional yardangs ? ESA asks if they are ancient bedrock features etched by the wind-borne sand, lava flow fronts, or deposits left by melting glaciers. My first reaction was that they are fractures – or cracks : but then I looked again. Notice how many of the purported “lines” are in fact made of small off-set segments, each segment oriented in the same direction. Notice also how these short segments are overprinted on – and therefore younger than – the erosional yardangs. I’m leaning toward the idea that these might be some form of sand dune feature : but I’m not sure.
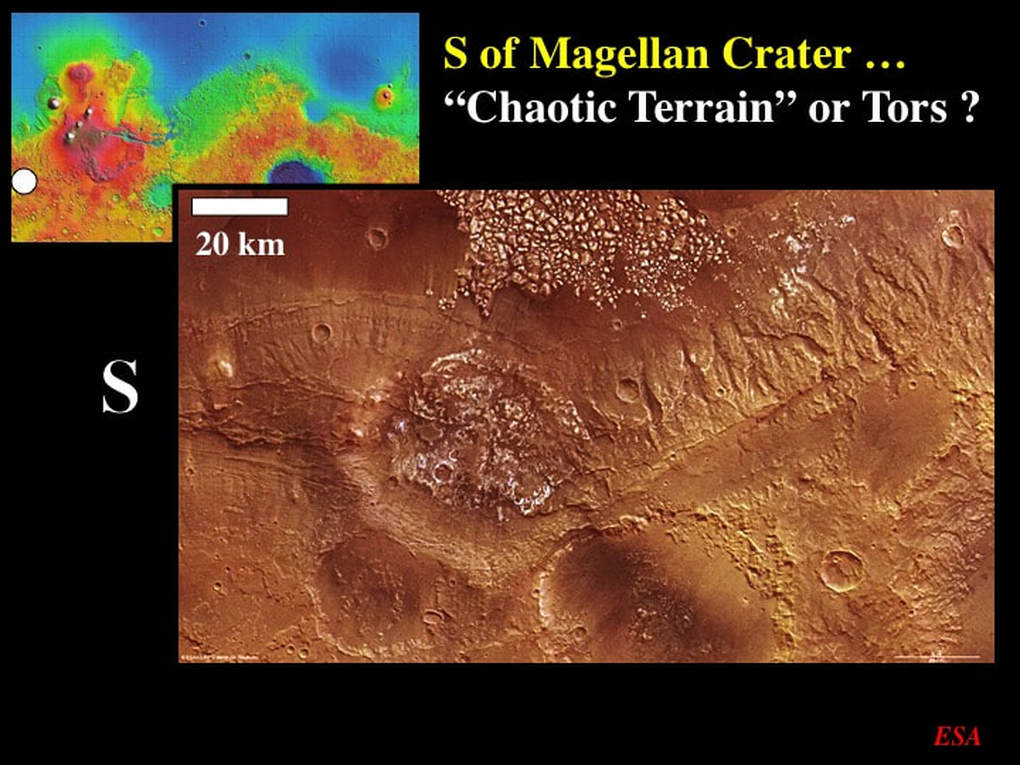
Moving a little south of the last station, still west of the Tharsis Plateau, this image is located immediately south of Magellan Crater. There are lots of things to see here – but I want to focus on just two : frost and what looks like “Chaotic Terrain”. The whitish area in the middle of the image and the scattered patches in the upper right corner are seasonal CO2 frost. However, what I really want to focus on is the cluster of light coloured lumps in the top centre of the image. ESA describes these as irregular protrusions up to 2km tall (also, note the scale bar). It may be that their light colour is also due to CO2 frost as opposed to their geological composition.
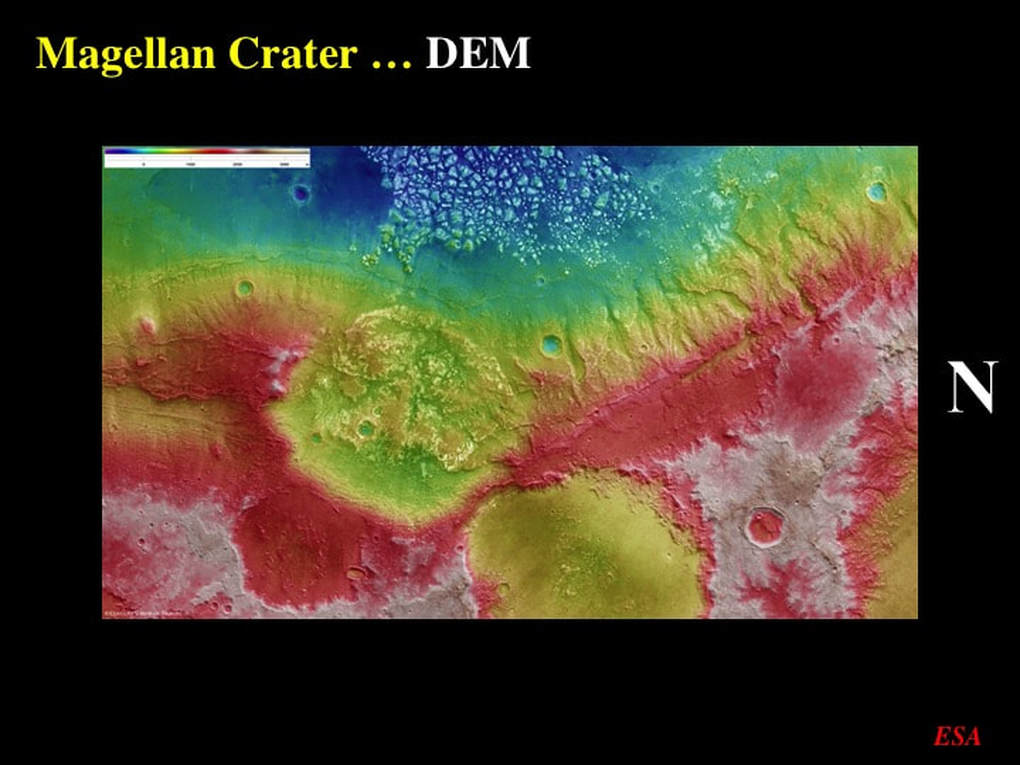
They are big enough that they stand out remarkably well in the DEM image of the same scene. Notice that they also lie within a lowland area, though I don’t know if that’s significant here
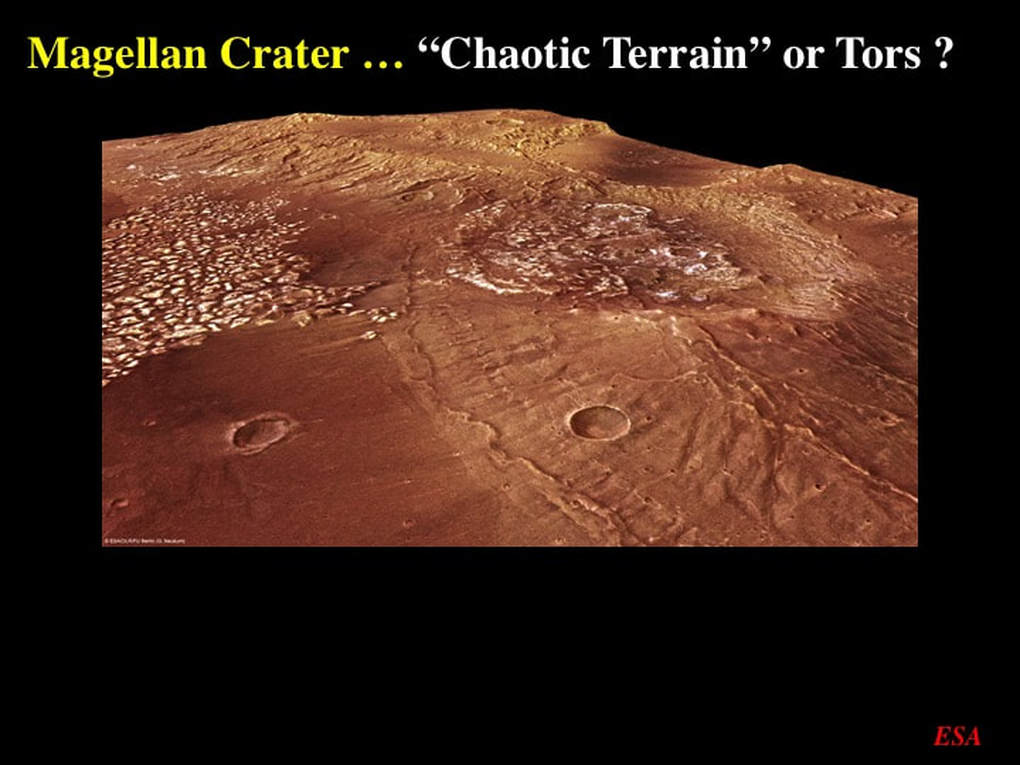
Here’s a 3D perspective image that shows the “protrusions” at the base of the slope, with the frost field about mid-way to the topographic height of land. ESA offers two explanations for the field of “protrusions” : shattering of the rocks due to an impact, or the classical “Chaotic terrain” model of melting permafrost and surface collapse that we’ve just discussed. Well hang on just a minute here; let’s go to Devon in SW England and see what we can learn there !
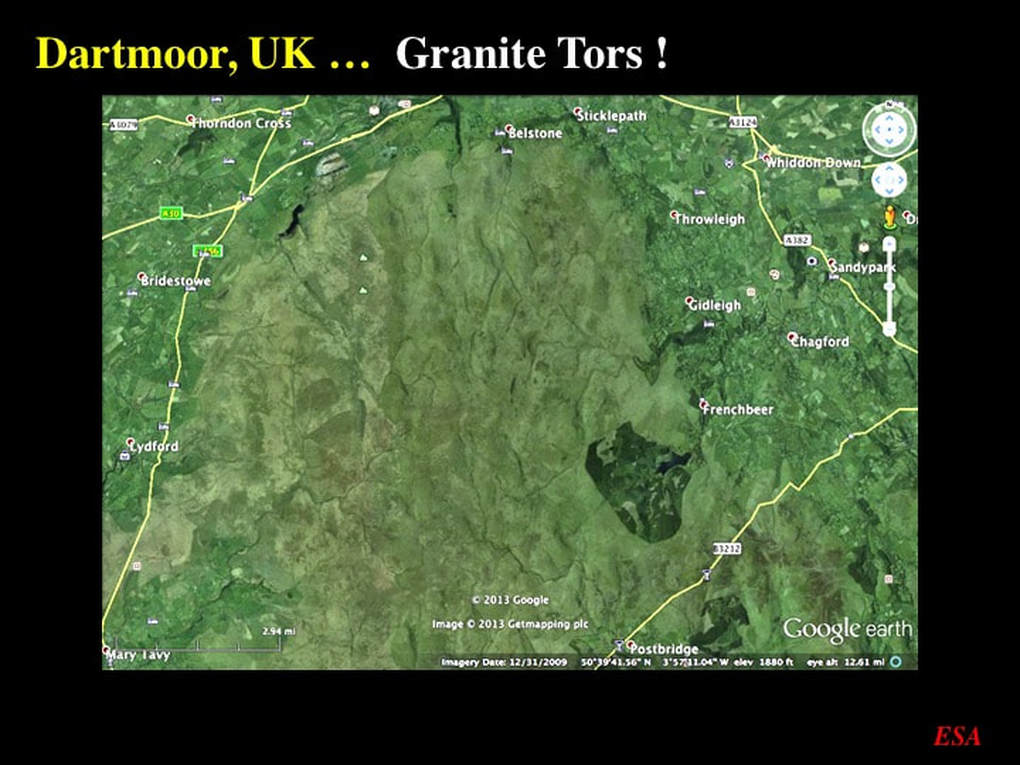
Here’s a Google Earth image of Dartmoor in Devon : this is Sherlock Holmes’ “Hound of the Baskervilles” country. Dartmoor is famed for its Tors : lumpy, bumpy topography that formed by the differential resistance of granite to the forces of erosion due to the presence of fracture systems in the bedrock. You can see the Tors in this image - and yes, there really is a village called Frenchbeer. My point being that the bumpy. lumpy terrain on Mars may not be so unusual after all … and may not require a special explanation.
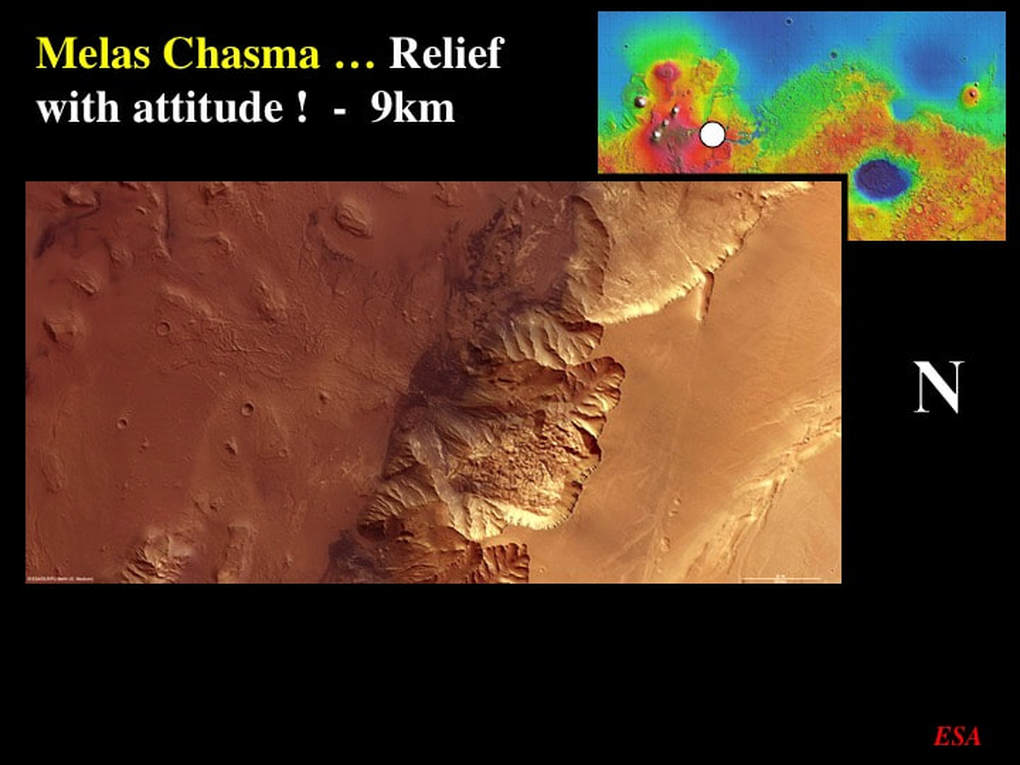
At its most basic, topography is a matter of comparing what’s high with what’s low. Well, topography doesn’t get much more extreme anywhere in the Solar System than within the Marineris Valley – in this case in Melas Chasma. You wouldn’t know it, but here we’re looking at 9km of rugged relief from the plateau on the right (North) to the bottom of the chasm on the left. Can you see the landslide and the material that ran way out onto the chasm floor ?
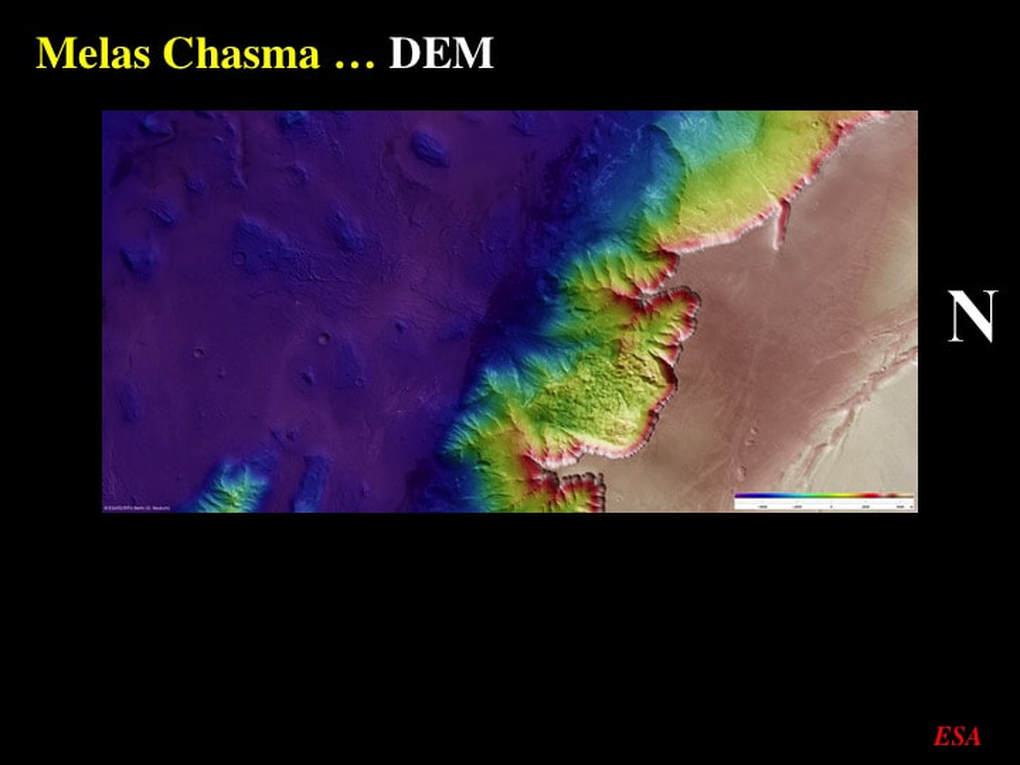
The DEM emphasises the relief and the landslide, but still doesn’t do it justice.
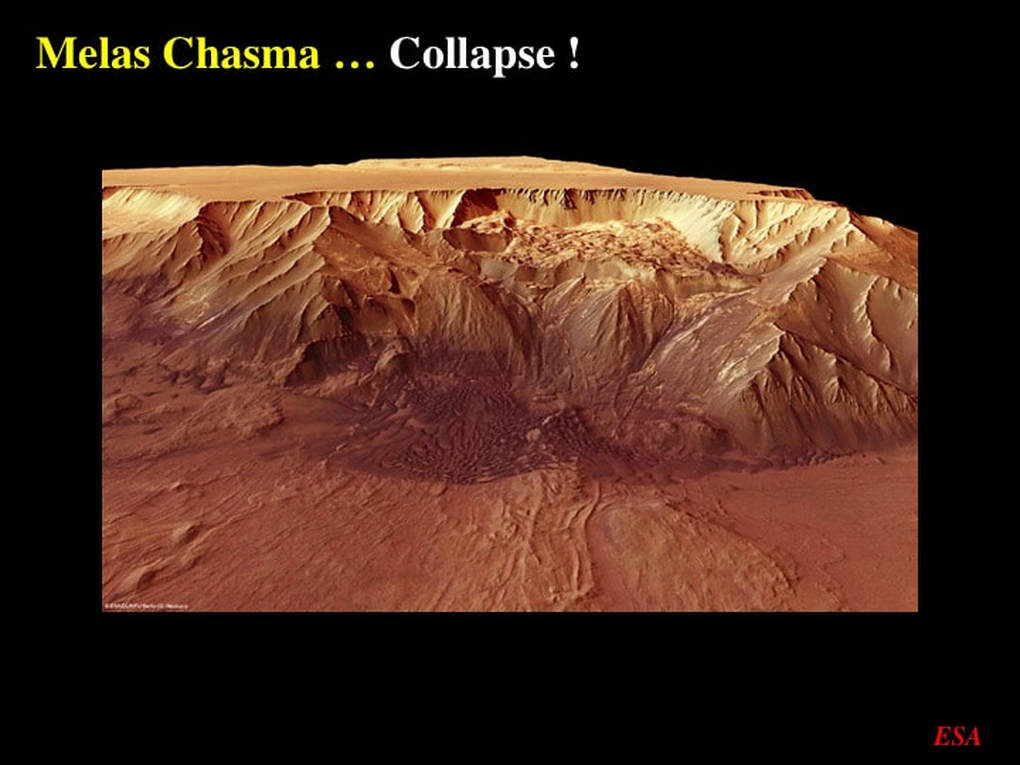
However, the perspective images do. Here we’re looking face-on at the top of the plateau, the landslide along the chasma wall and the outwash onto the chasm floor in the foreground; vertical drop of 9km. Remember – terrestrial Everest is only 1km higher than this ! … and that’s above sea level. Also note that there is a x4 vertical exaggeration in these images.
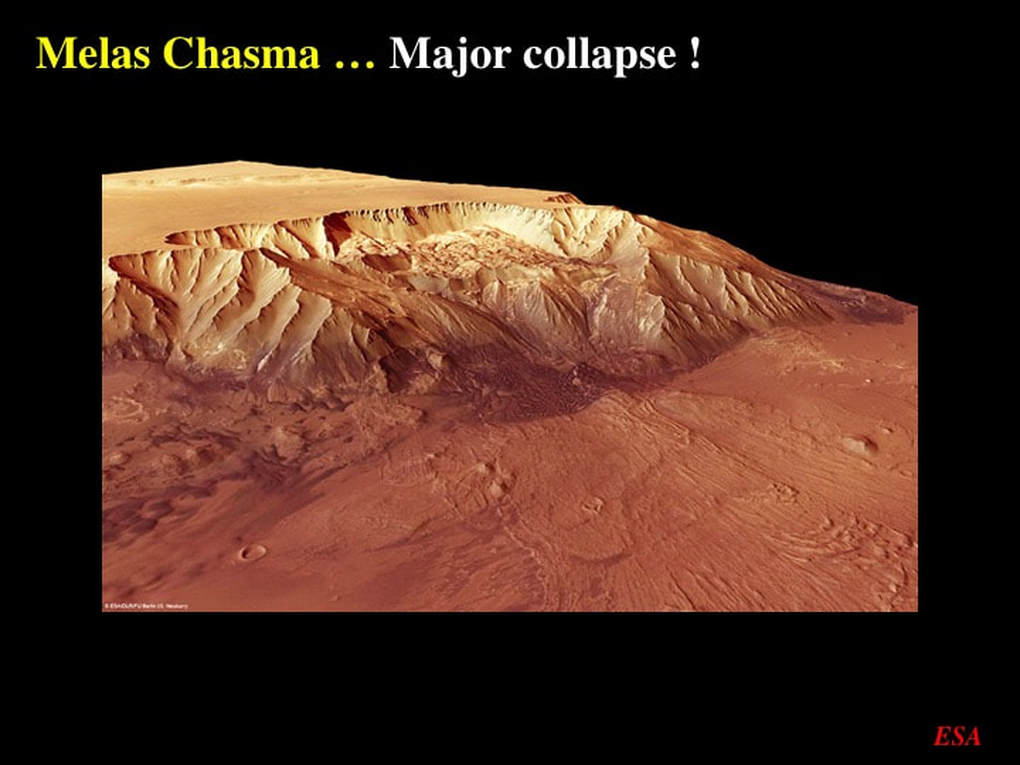
I think that the landslide and outwash are best brought out in this oblique 3D perspective view. ESA has really done itself proud with this image !
So after all these diverse images, what are my two take-home messages ? First : public space science agencies have a lot more for us to discover than they manage to tell us about. They’re not hiding it – their extensive images are in the public domain and readily available. They just don’t do a very good job of telling us about it. Second : do go to the ESA website and look at these images yourselves. The high resolution on your own computer screen is a wonder to behold. However, a word of caution : Caveat Emptor - don’t believe all you read on the NASA, JAXA and ESA web sites when it comes to planetary geology!
So after all these diverse images, what are my two take-home messages ? First : public space science agencies have a lot more for us to discover than they manage to tell us about. They’re not hiding it – their extensive images are in the public domain and readily available. They just don’t do a very good job of telling us about it. Second : do go to the ESA website and look at these images yourselves. The high resolution on your own computer screen is a wonder to behold. However, a word of caution : Caveat Emptor - don’t believe all you read on the NASA, JAXA and ESA web sites when it comes to planetary geology!
Proudly powered by Weebly
