|
GRAIL
|
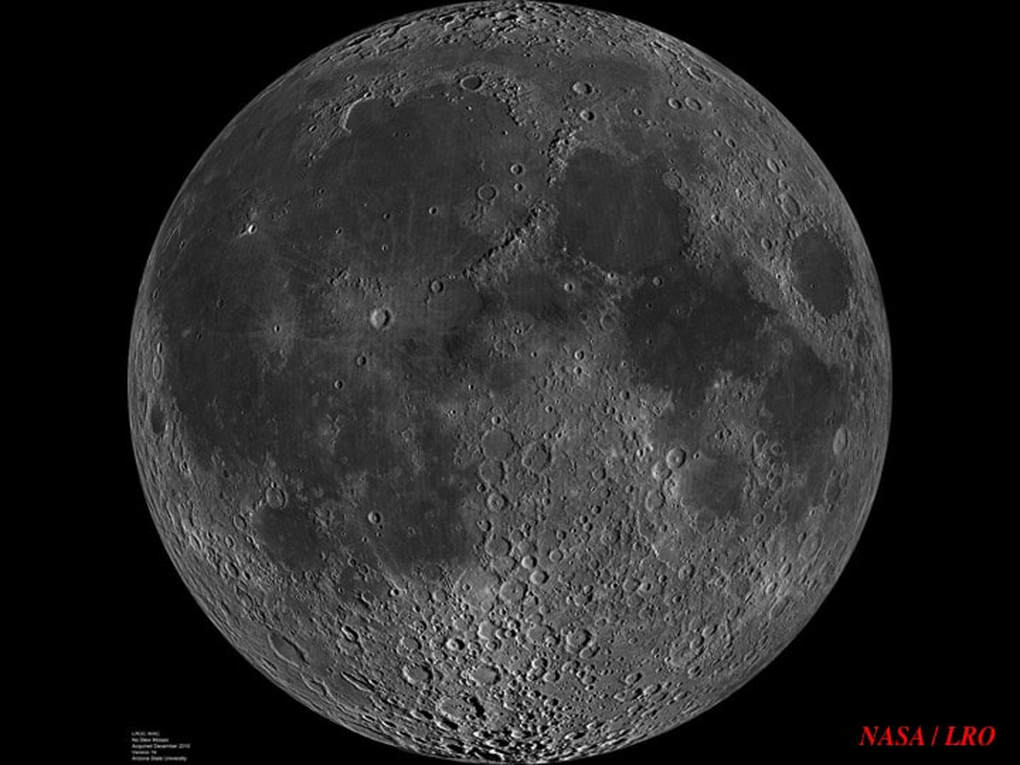
Most amateur astronomers enjoy observing the Moon through their backyard telescopes, but what would we see if, instead of looking at the Moon using light, we looked at it using gravity? For geophysicists gravity is a major observational tool, principally used to detect and study geological features hidden from sight – hidden underground.
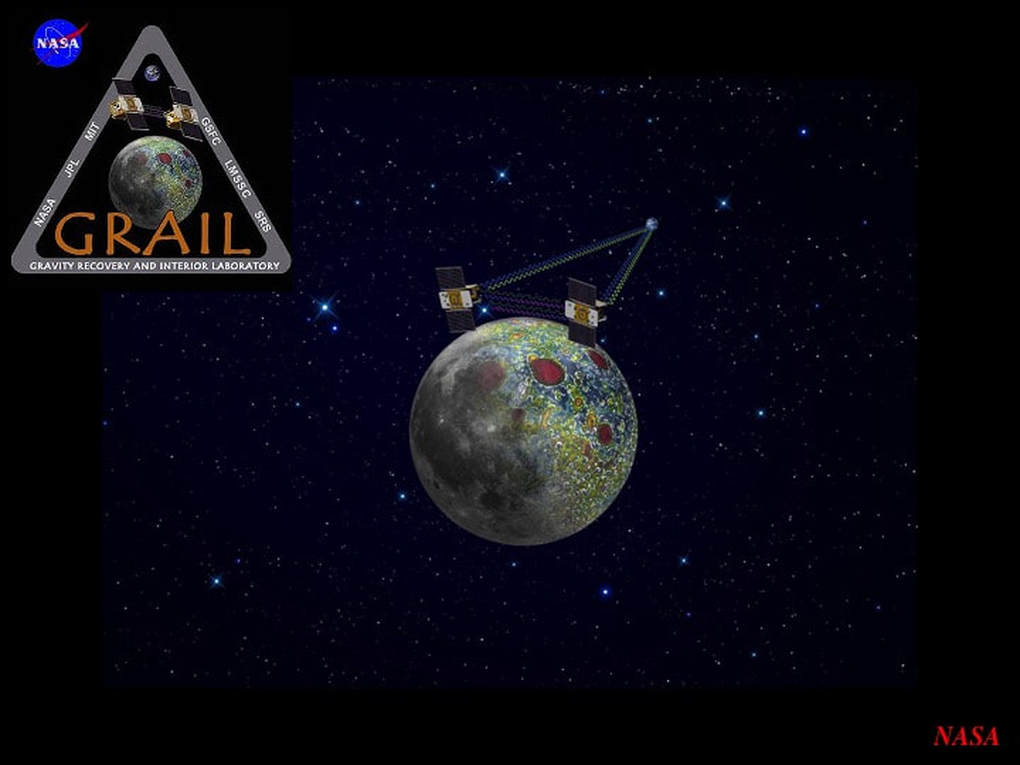
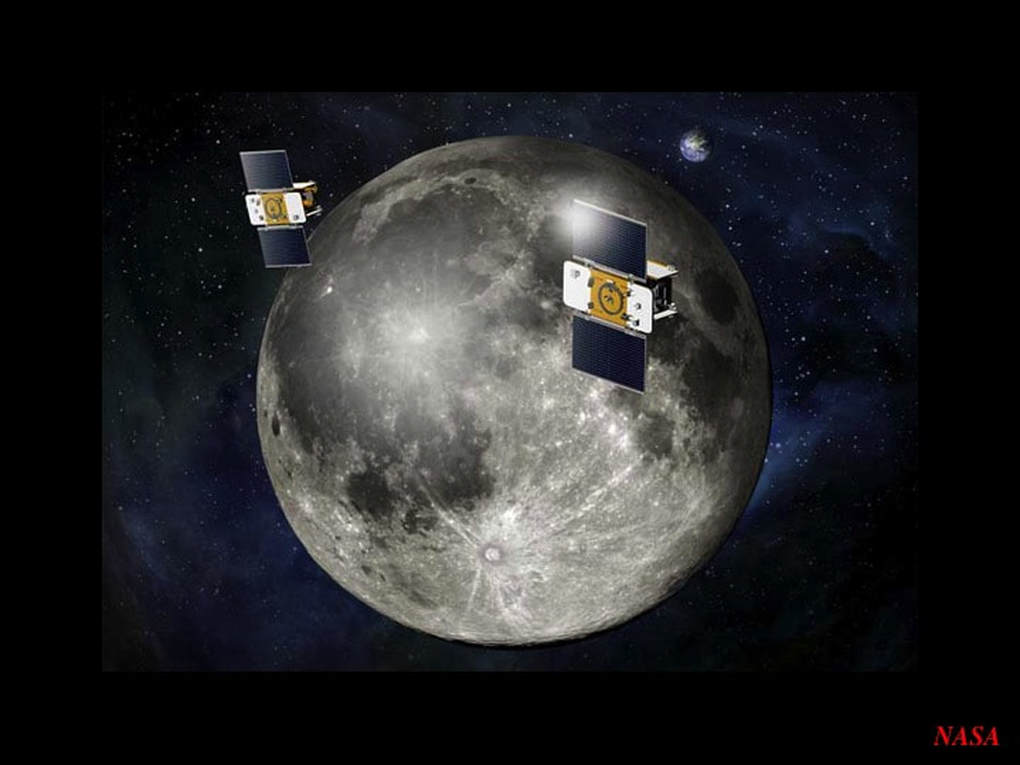
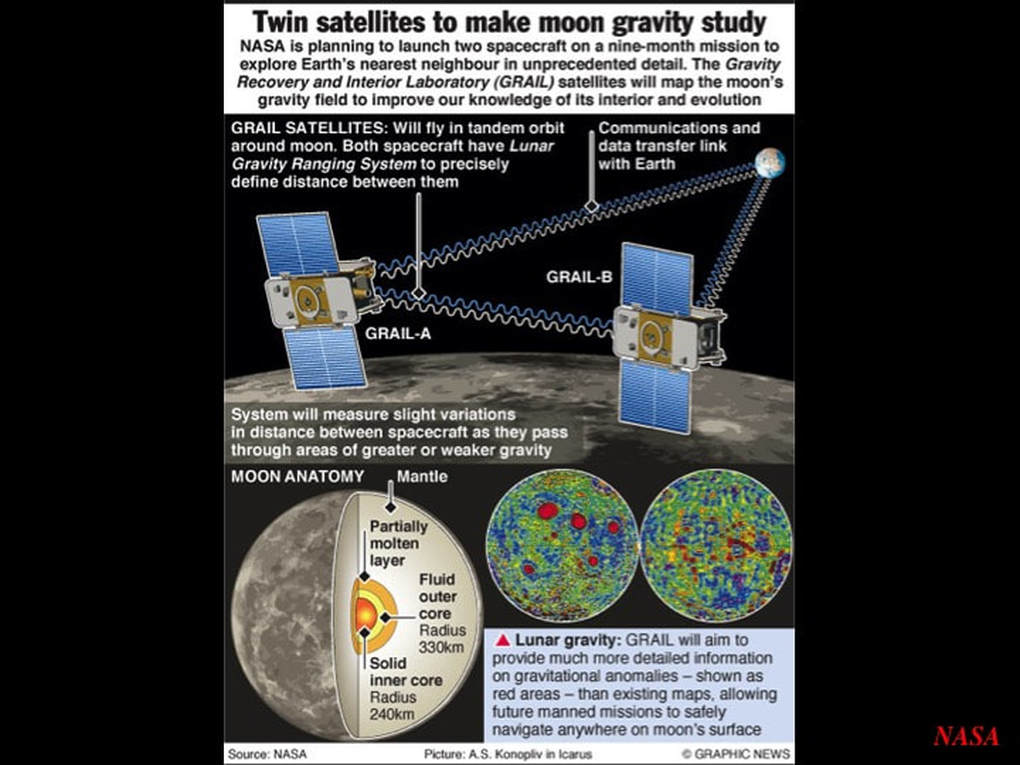
In 2011 NASA launched an extraordinary gravity experiment to investigate the Moon in high resolution. GRAIL (Gravity Recovery and Interior Laboratory) comprised two satellites, each about the size of a fridge, nicknamed Ebb & Flow. As they chased each other in orbit around the Moon, variations in the gravitational tug of different parts of the Moon changed the distance between the two satellites. Geophysicists then used these changes to make high resolution maps of the Moon’s gravity.
NASA’s mission description gives us a general introduction to what the GRAIL satellites are really recording : in other words, what the gravity values mean. Gravity measured over any point on the Moon is the product of the total lunar mass below that point, right down to the lunar core. However, since the magnitude of gravity varies with distance, the deep lunar interior contributes a broad background signal, and most of the detailed variation in the gravity signal comes from the shallower parts of the Moon; those closer to the GRAIL satellites.
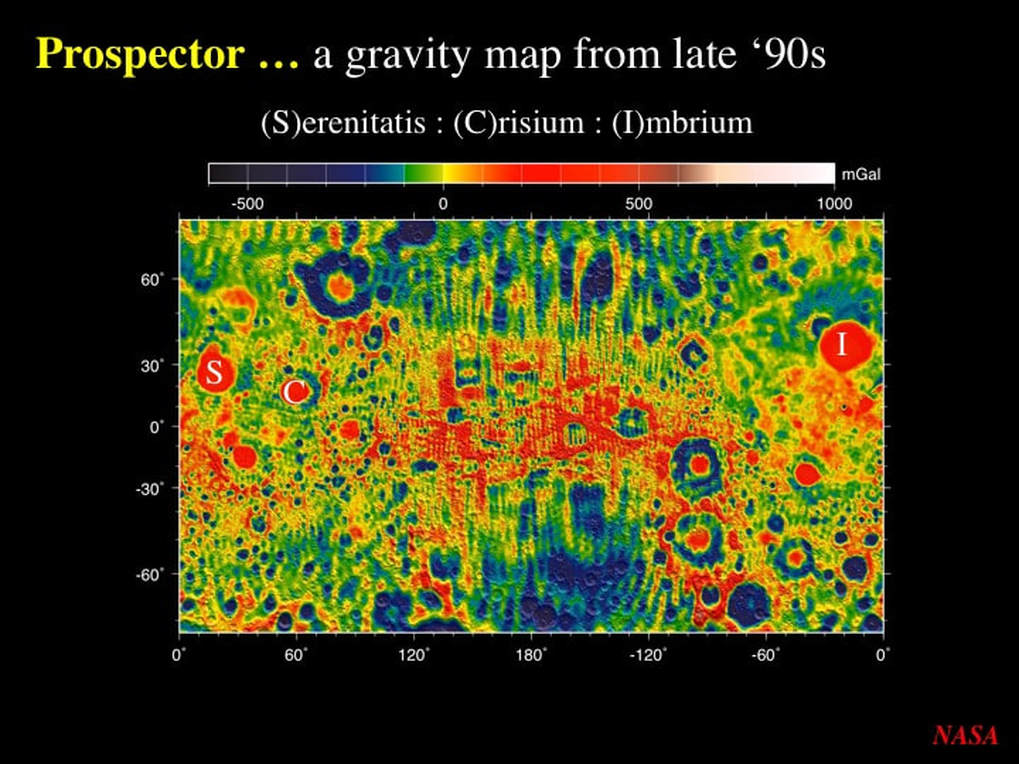
What do we mean by high-resolution maps of the Moon’s gravity ? Here’s an older gravity map of the whole Moon from the late 1990s obtained by the orbiting Prospector probe. Yellow is the general background gravity signature. The red colours indicate stronger gravity signatures (positive anomalies) and the blue colours indicate weaker gravity values (negative anomalies). Note two things : First, there are circular anomalies in this map – some of which are concentric in form. You’ve already guessed that these are large impact basins. Second, there’s a general NS graininess to the image that tends to blur the details. This is a low resolution gravity map.
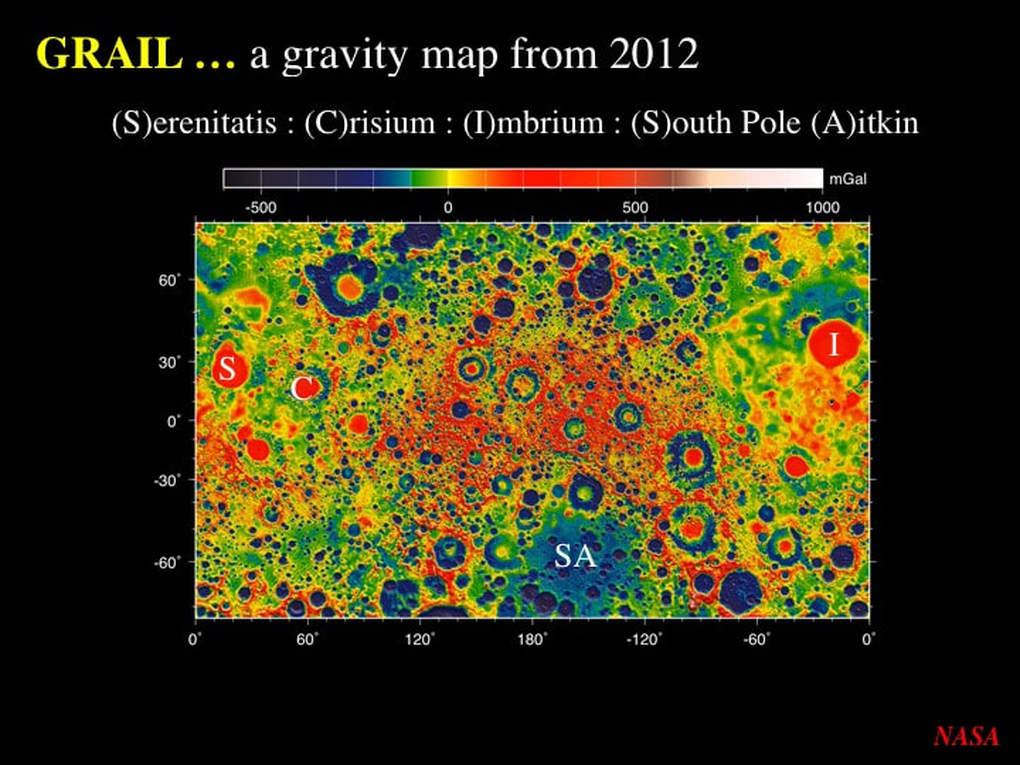
Here’s the equivalent map made by GRAIL in 2012. I think you can easily see why this is a high resolution image : there’s so much more detail readily observable here.
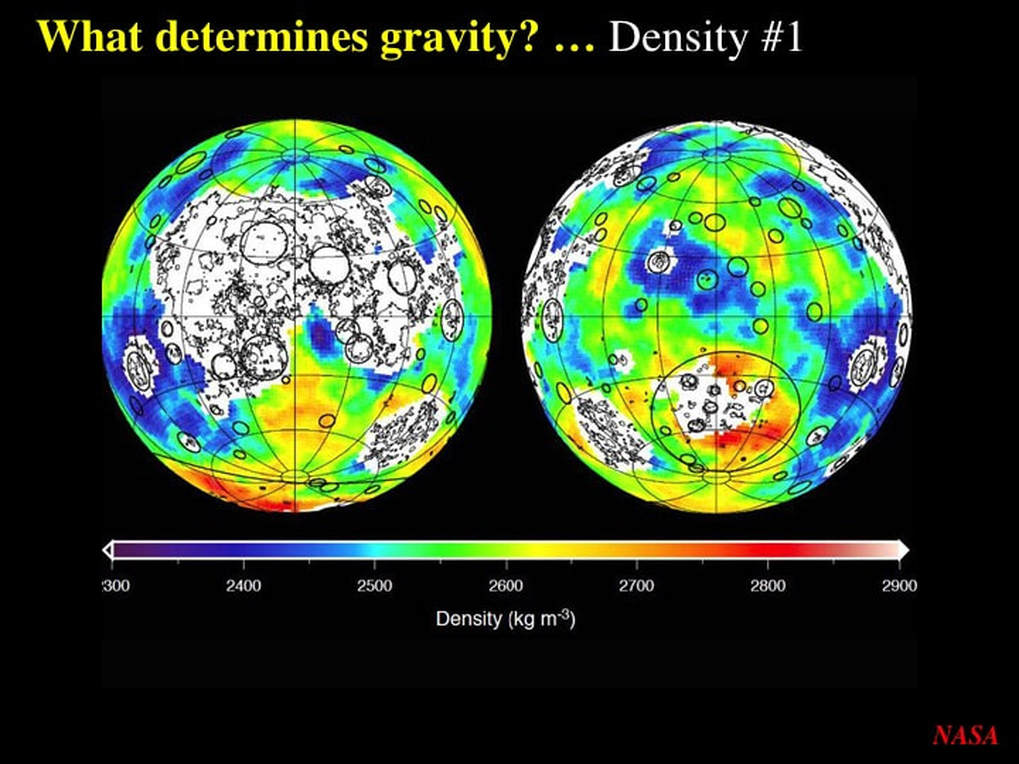
What are the factors that determine the strength of gravity and whether we record positive or negative anomalies ? Issac Newton in the 17th century demonstrated the critical role played by distance, but he also showed the primary role played by “mass”. At high school you learned that mass is directly related to density, and rocks of different chemical composition have different densities. These Near & Far side maps give you some idea of the broad variations in density outside of the major lunar Mare (basalt), which are white in this image.
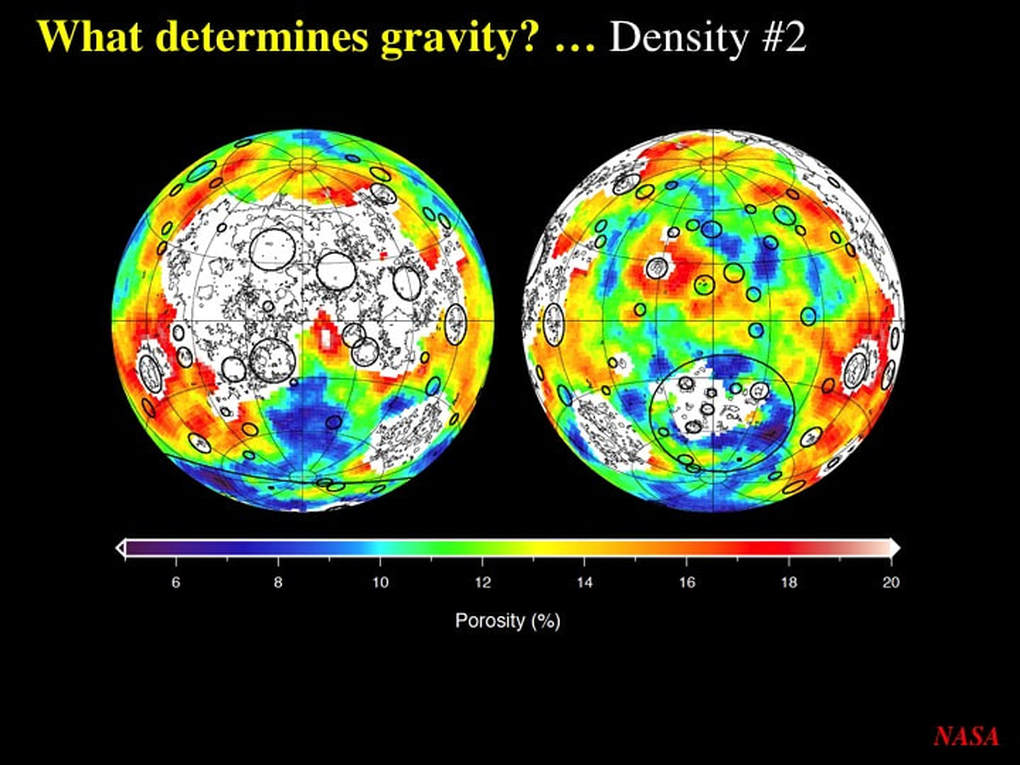
However, density is not just a function of chemical composition in an environment like the Moon. Billions of years of impacts have broken up the lunar surface into everything from boulders to dust – introducing pore spaces (porosity) that decrease the density of the surface materials down to depths of several kilometres, thereby introducing further variation in the detailed gravity signature received by the orbiting GRAIL satellites.
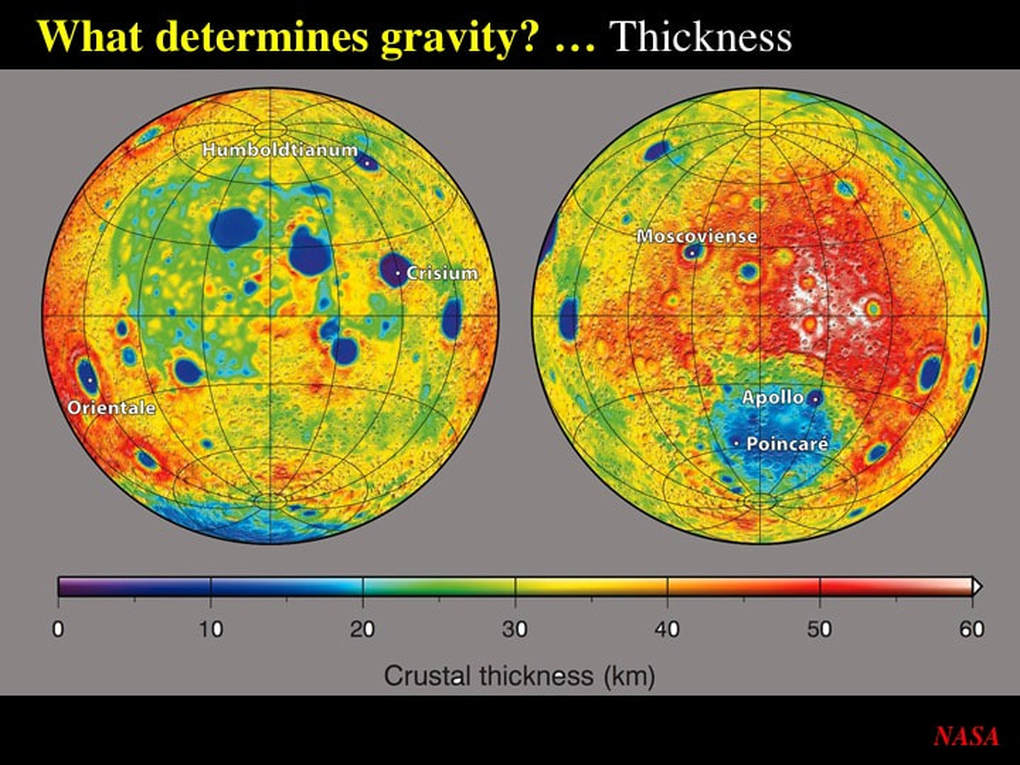
Like the Earth, the Moon has a crust, a mantle and a core, and each has a characteristic, though variable, thickness. This thickness variation leads to variable mass in each of these zones of the lunar interior - again inducing variation in the gravity signature detected by the GRAIL satellites.
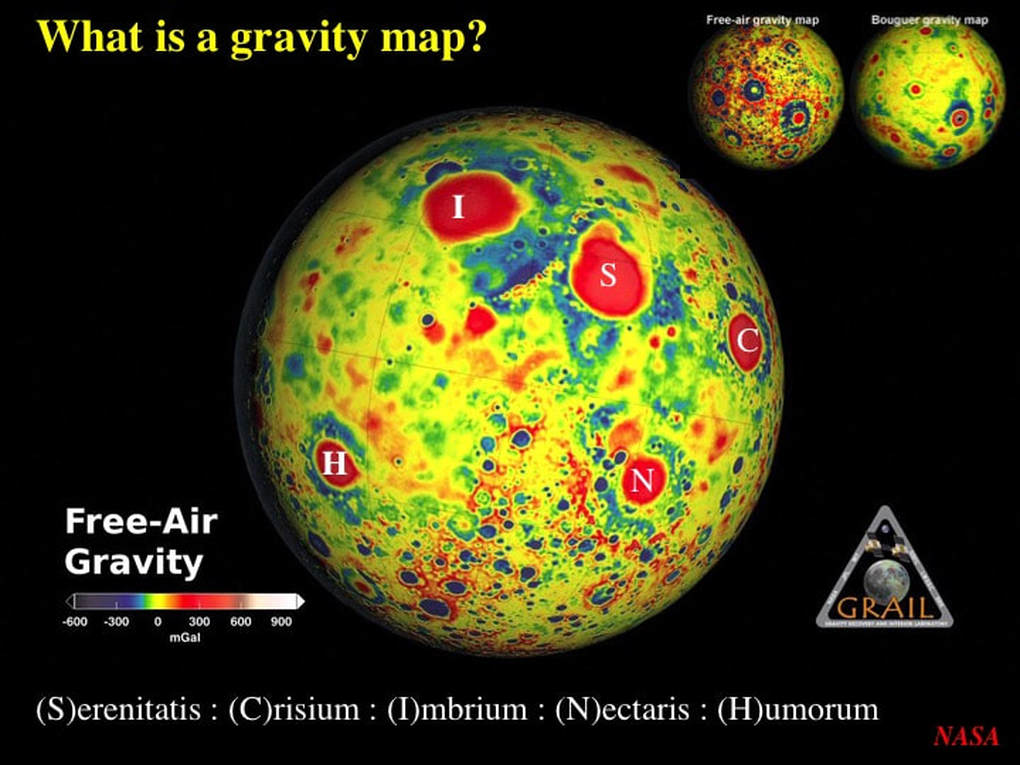
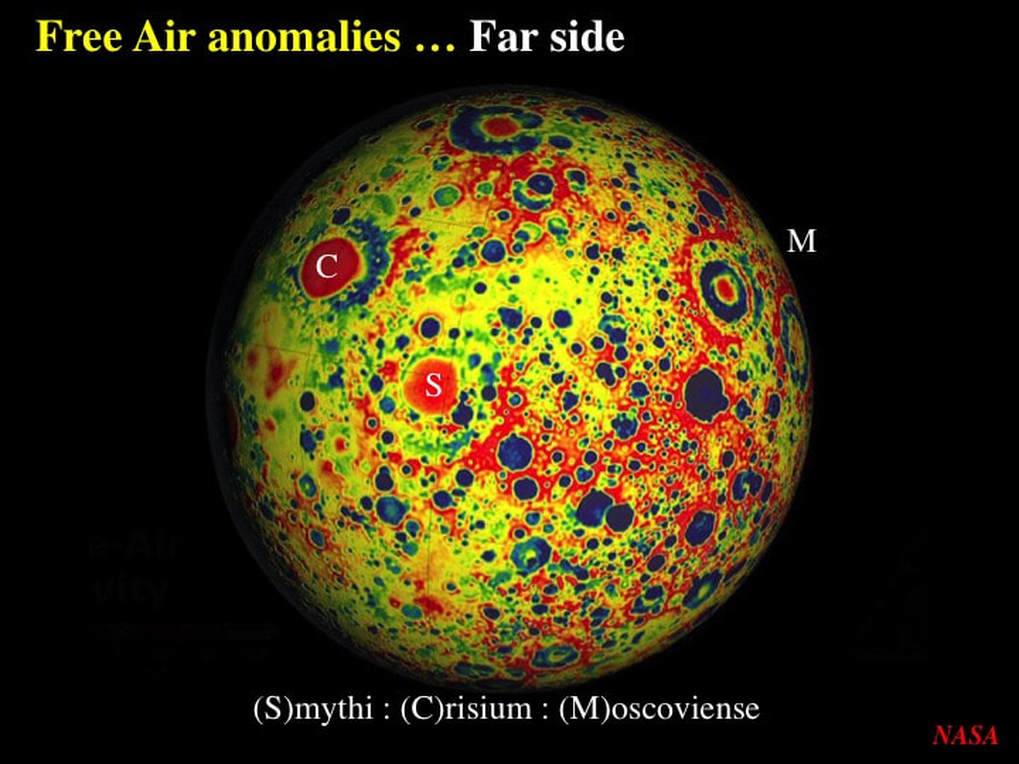
Now that we know what causes gravity to vary, can we now make a definitive gravity map of the Moon ? Well, yes – and no ! At least, not yet. There’s more we need to understand about making gravity maps first. Given that most of the detailed gravity signature comes from the near surface, we have to be very aware of the role of topography. Suppose we record the gravity variation over an extensive flat plain. The map of variations in gravity signature will only reflect the factors we’ve just discussed : density, porosity, thickness and depth below the surface of the rocks involved. However, what if we now dump a mountain range – say the size and height of the Canadian Rockies - onto our plain and then remake our gravity map. The extra “mass” of the mountains - that wasn't there first time around - is going to add new gravity signatures, depending on what the mountains are made of. Lighter rocks will tend to create negative gravity anomalies – and denser rocks will tend to form positive gravity anomalies. Such a map is referred to as a “Free Air” gravity anomaly map.
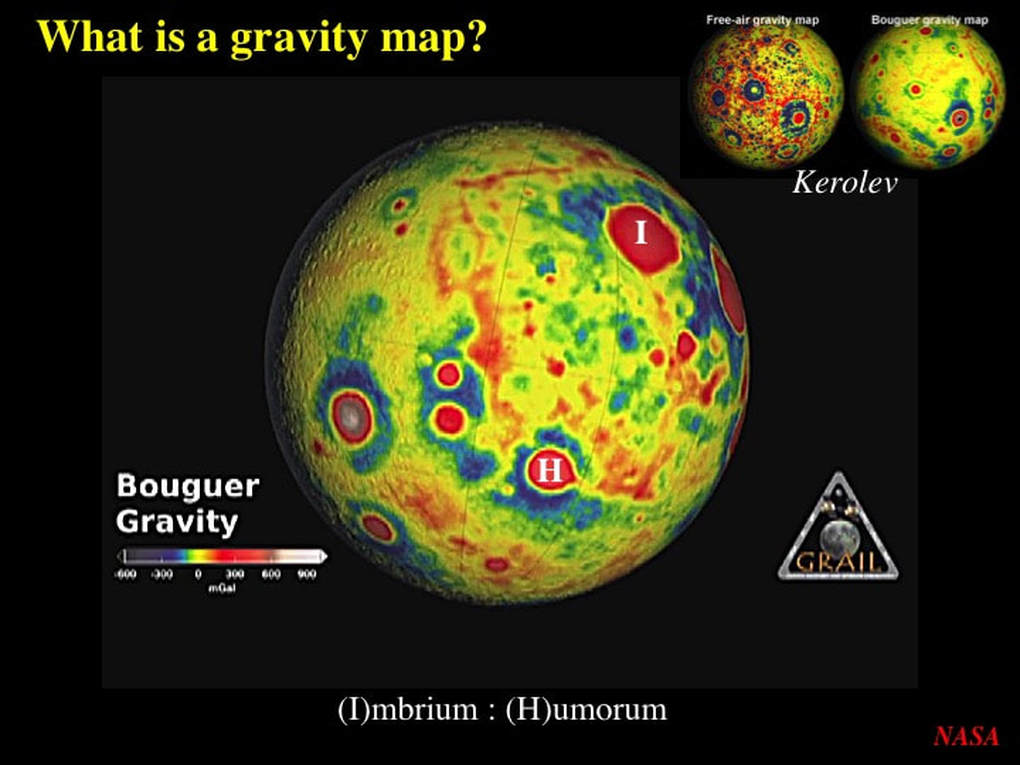
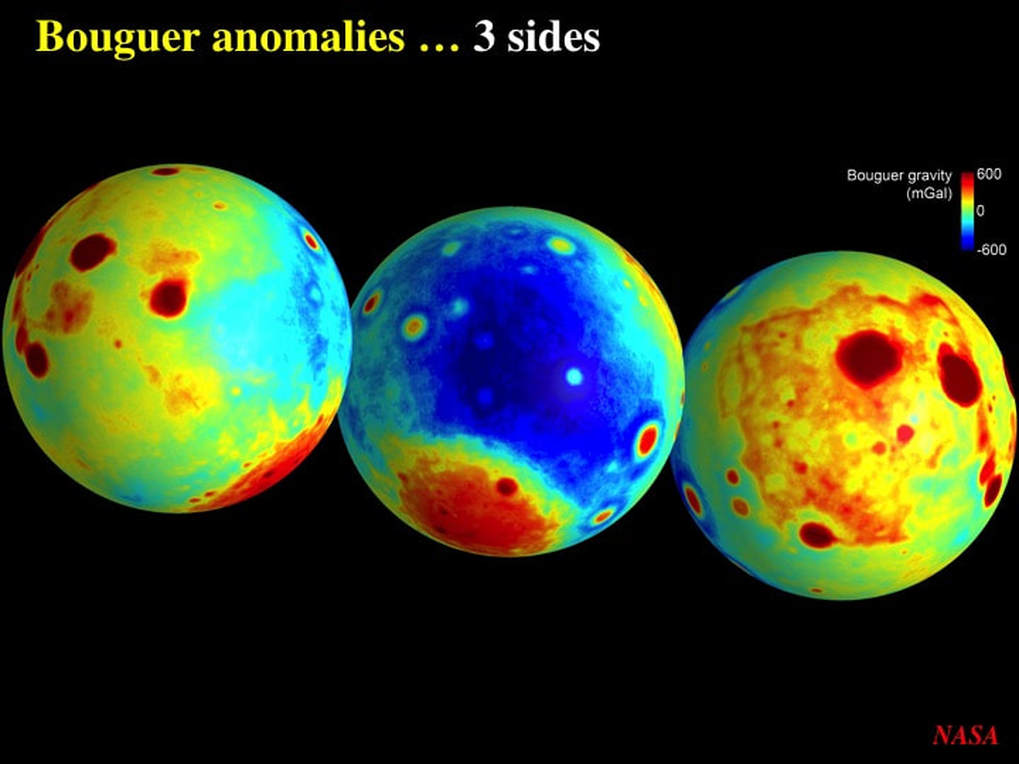
Now, if the geophysicist is trying to map geological features below the surface topography, (s)he must first remove the effect of the topographic mass. In short, we transform the raw gravity data to correspond to what we would see if the Moon were as smooth as a billiard ball. The result after processing is a “Bouguer” gravity anomaly map – named for the man who came up with the method of doing it.
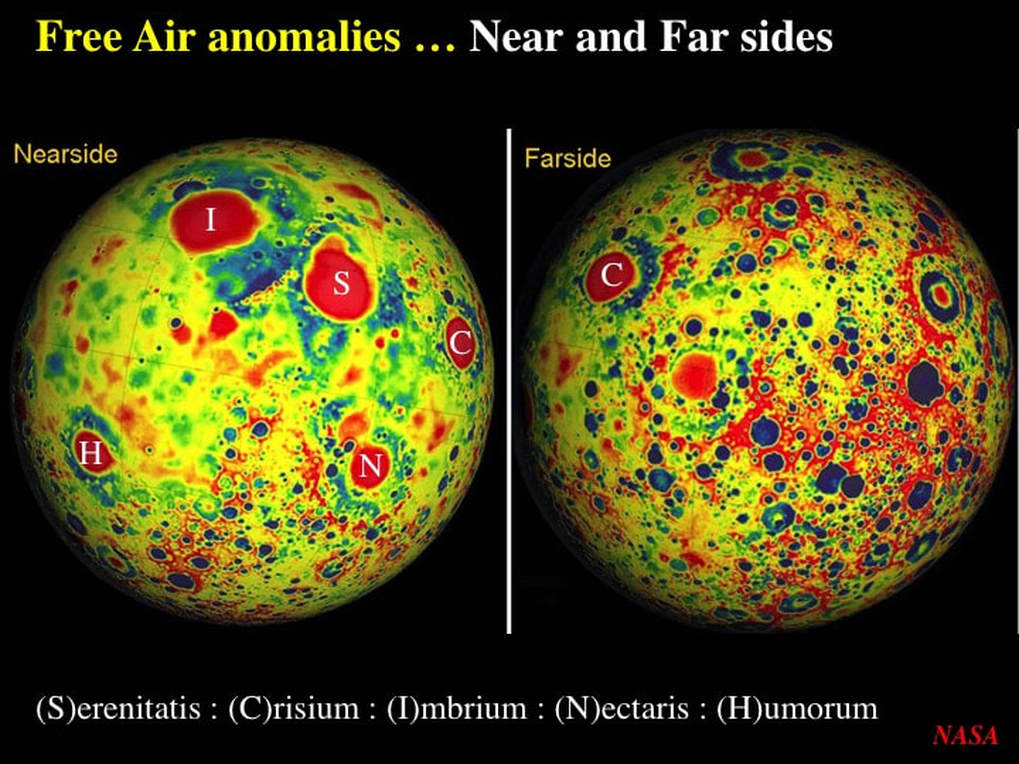
However, sometimes the Free Air gravity map is very useful, especially when comparing two areas of very different topography – such as the Near and Far sides of the Moon. Notice how very different their GRAIL Free Air anomalies are, and how they emphasise the detailed topographic variations on the Far side.
In fact, as you see here in this montage, Bouger gravity maps may lose a great deal of potentially useful detail, depending on how exactly they’ve been processed. It all depends on what you’re trying to emphasise …
OK : what’s my take-home message at this point ? If someone shows you a gravity map – of anything, including the Moon – your first question has to be “What kind of gravity map is this ?”, because you mustn’t compare apples with oranges.
OK : what’s my take-home message at this point ? If someone shows you a gravity map – of anything, including the Moon – your first question has to be “What kind of gravity map is this ?”, because you mustn’t compare apples with oranges.
So – now that we understand what basic gravity maps are, what do the GRAIL maps tell us about the Moon ? Here again is the detailed Free Air gravity anomaly map of the lunar Far side. Large circular red anomalies are positive gravity anomalies that tell us that those impact basins are what is known as “mascons” – or mass concentrations. Something very dense lies at some relatively shallow depth beneath these impact basins. What is it ? Is it the mass of a dense impactor ? Or is it the mass of dense lunar mantle material that rose toward the surface in response to the impact ? Note the large number of smaller circular negative gravity anomalies (blue) that represent relatively large impact craters. Why do they have negative gravity anomalies ? Perhaps they are filled with fractured, crushed and pulverised rock derived from the impact, hence relatively low in density. Finally, note the large concentric circular anomalies, comprised of a central positive gravity anomaly, surrounded by a ring of negative anomaly, itself enclosed by an outer ring of positive gravity anomaly. These appear to be “mascons” surrounded by an inner ring of impact ejecta, surrounded itself by an outer ring of something dense.
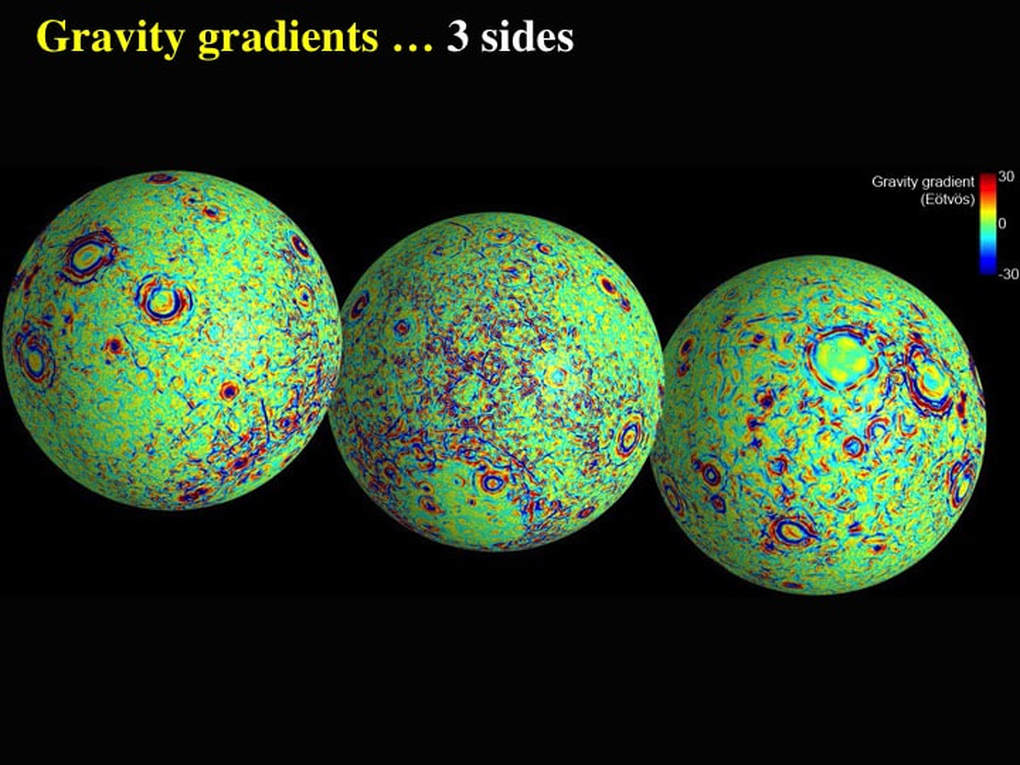
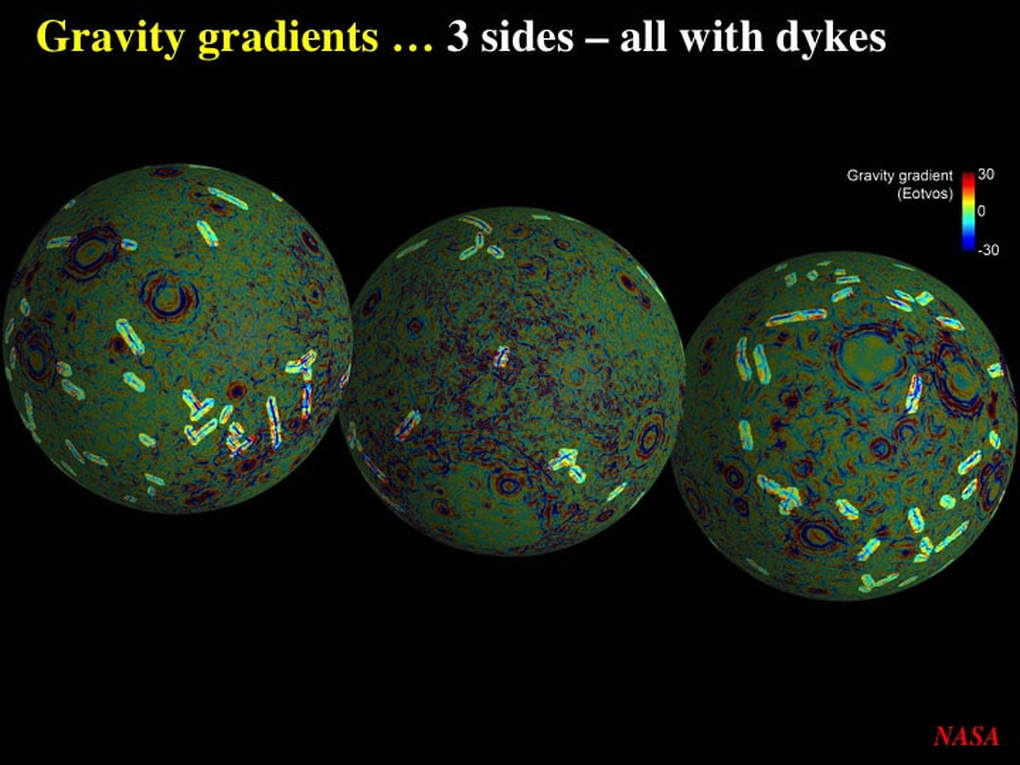
Let’s now turn to one of the most powerful geophysical methods for processing gravity data in order to image hidden geological features : gravity gradients. If a gravity signature varies in 3D, then it is possible to make maps of the variation itself. This is done by quantifying the rate of change of the gravity values either in the horizontal direction or in the vertical direction. The resulting gravity gradient map no longer features gravity values, but gradient values. These three views of different faces of the Moon show a background vertical gravity gradient value in green and both positive (red) and negative (blue) linear gravity gradient anomalies – some of which are arranged as concentric rings.
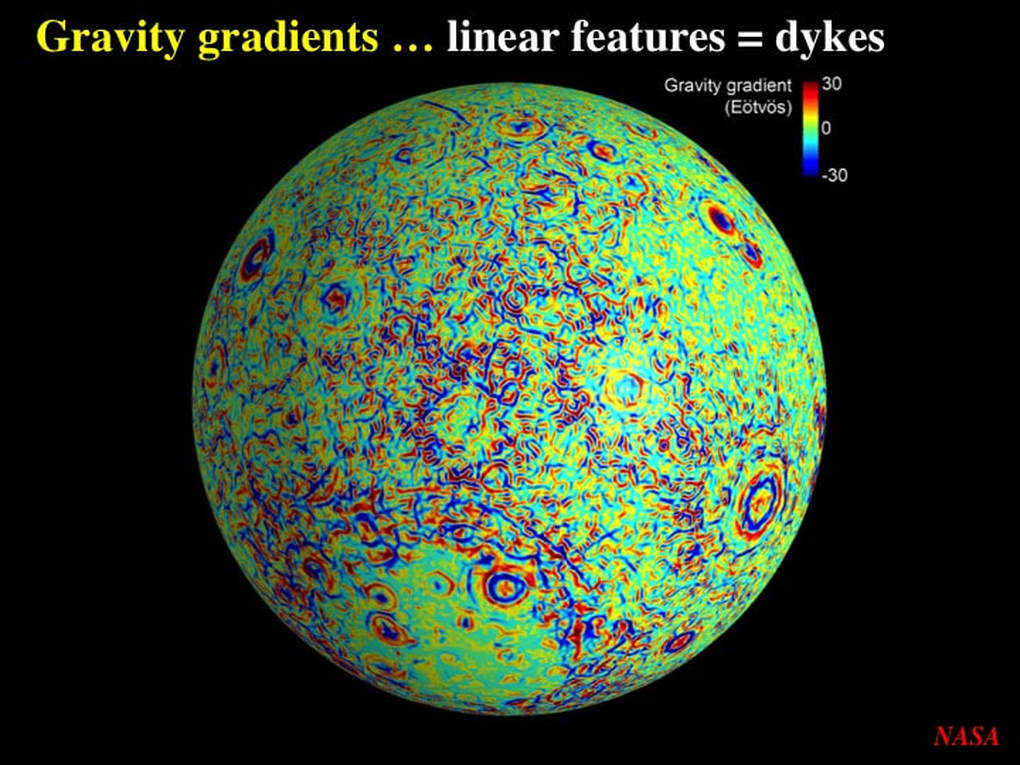
What does all this mean ? Here’s a detailed look at the lunar Far side (note the South Pole-Aitken Basin near the South Pole). The circular, concentric gravity gradient anomalies clearly relate to large craters and impact basins. I’m not going to get into the alternating positive and negative anomalies here : it’s complicated ! However, note the long, linear negative gradient anomalies in blue. These are interpreted to represent dykes of basalt – hundreds of kilometres long : vertical sheets of magma that rose from the interior of the Moon in its early history, and these are much easier to understand. Why are they systematically blue (negative) ? That part is also complicated, but there is an explanation (see Appendix at the end).
If we now return to the gravity gradient maps of the three faces of the Moon, we see that these 100+ km long dykes are everywhere !
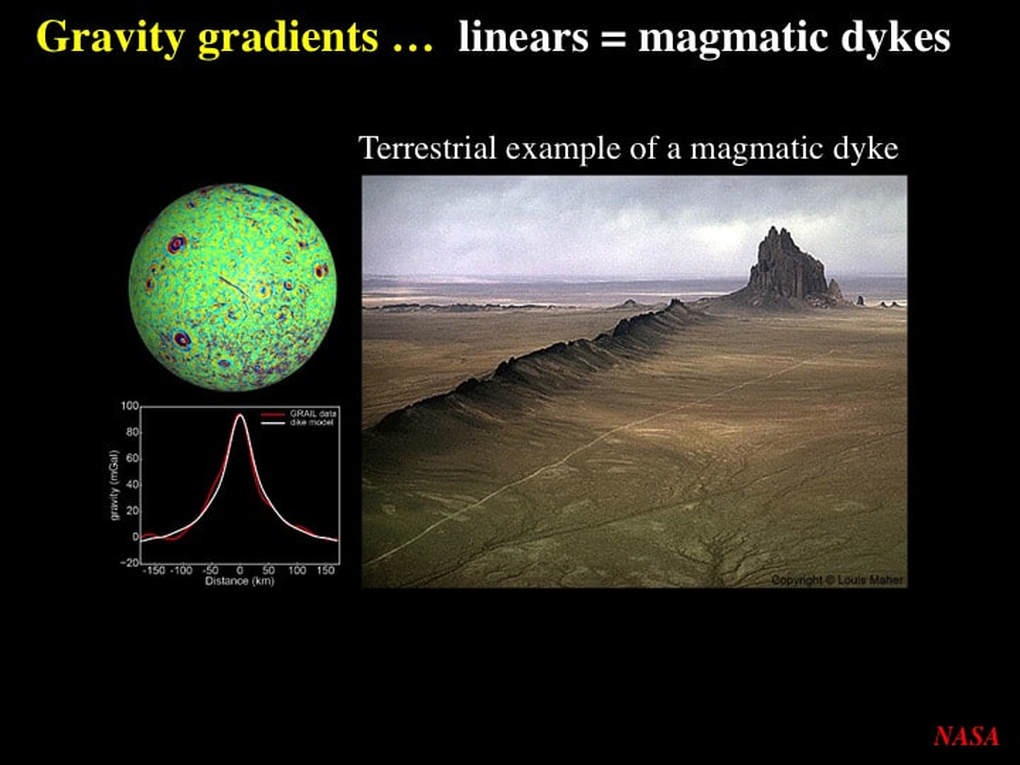
But hold on just a minute here ! If these giant dykes are everywhere on the Moon, shouldn’t we be able to see them with telescopes ? Here’s an example from Earth, and there’s no doubt about the presence of the magmatic dyke.
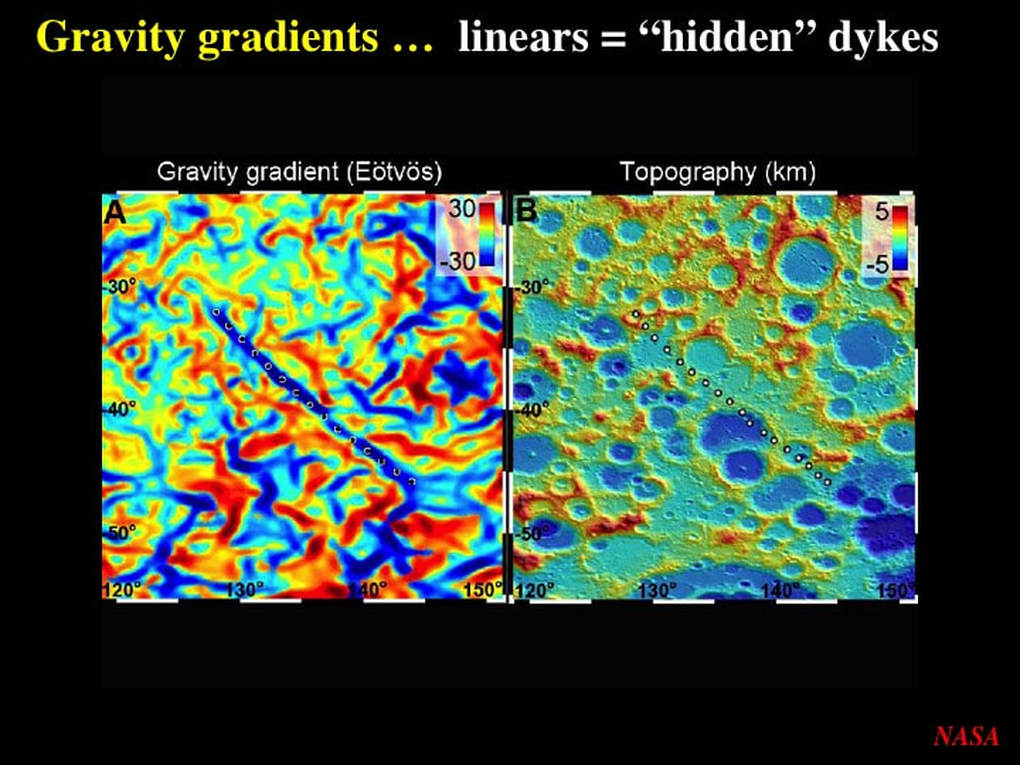
But, in this lunar example we can clearly see the linear gravity gradient anomaly associated with a dyke (left), but no topographic expression of the dyke itself (right).
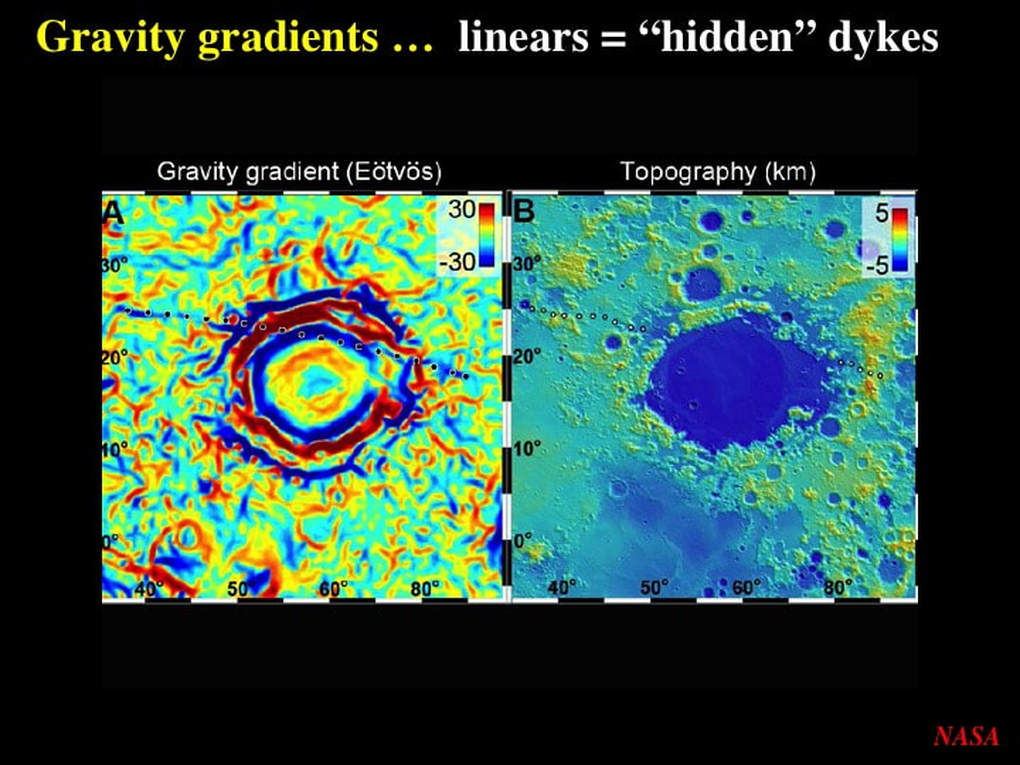
Here’s another example of a linear gravity gradient anomaly corresponding to a dyke with no surface expression, where you can also see that the complex circular gravity gradient anomalies associated with an impact feature are not expressed in the surface topography. In addition, you can clearly see that the impact feature interrupts the linear anomaly, demonstrating that the magmatic dyke is pre-impact in age in this case.
The likely explanation for the visual absence of these very large magmatic dykes on the Moon is quite simple. Either the surface of the Moon has been heavily “gardened” by billions of years of impact cratering, thereby obliterating any surface expression of these ancient dykes, or the dykes are deep-seated and did not rise into the shallow lunar crust. Remember, on Earth it is the differential resistance to recent erosional agents such as ice, water and wind that allows the topographical expression of similar magmatic dykes at the planetary surface – and these are absent on the Moon !
The likely explanation for the visual absence of these very large magmatic dykes on the Moon is quite simple. Either the surface of the Moon has been heavily “gardened” by billions of years of impact cratering, thereby obliterating any surface expression of these ancient dykes, or the dykes are deep-seated and did not rise into the shallow lunar crust. Remember, on Earth it is the differential resistance to recent erosional agents such as ice, water and wind that allows the topographical expression of similar magmatic dykes at the planetary surface – and these are absent on the Moon !
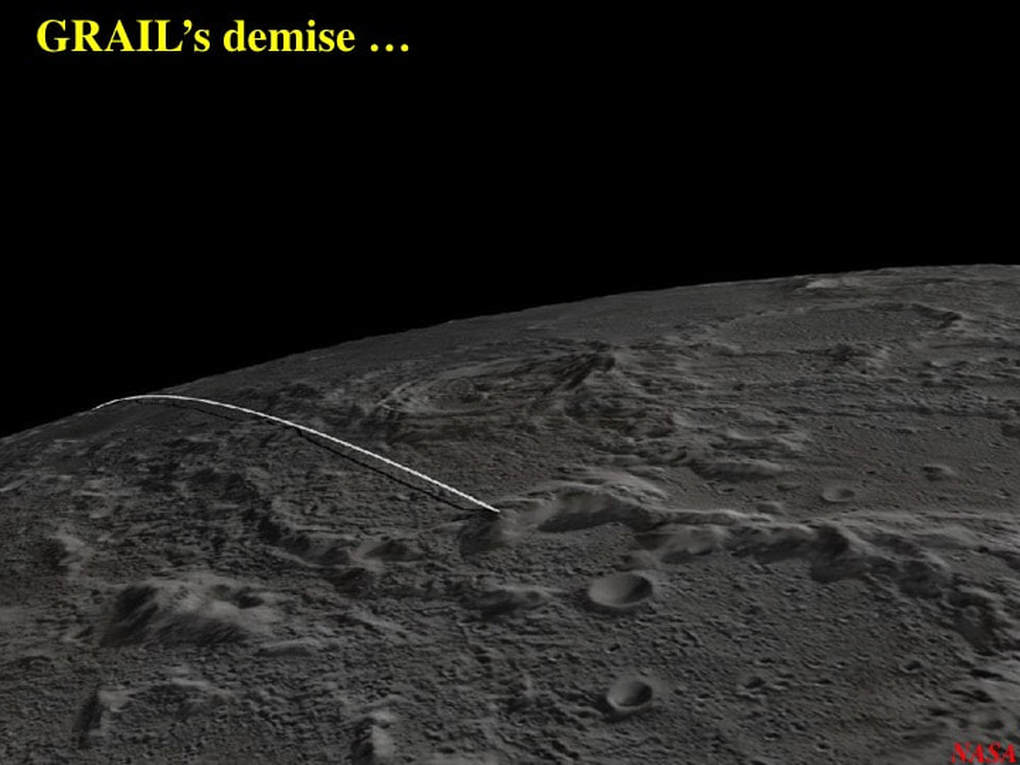
Finally, the GRAIL mission ended in December 2012 with the deliberate collision of the Ebb & Flow satellites into the lunar surface at a site now named in honour of astronaut Sally Ride.
So here’s my final take-home message : Next time you’re looking at the Moon through your telescope – remember that the Moon doesn’t reveal all of her secrets to you.
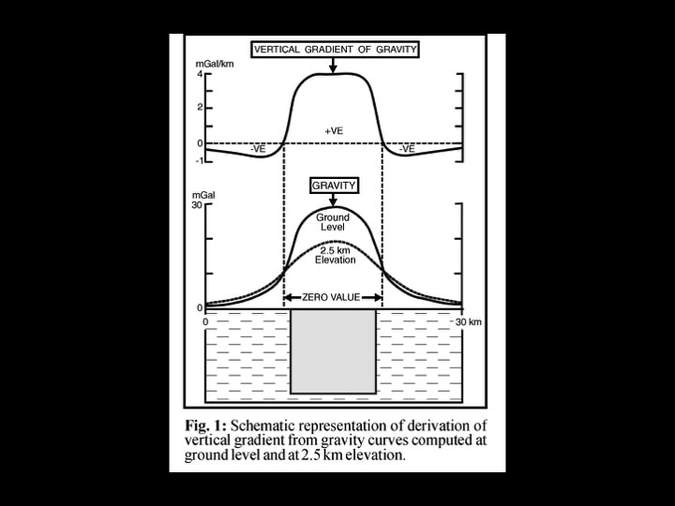
APPENDIX : What is a "vertical gradient" ? It's the difference between the values of gravity at two different altitudes : e.g. for this example, ground level and 2.5 km elevation. Now imagine a slab of dense basalt surrounded by less dense rock (e.g. anorthosite). The excess mass of the dense dyke will give a positive gravity response over the dyke. However, if we now subtract the gravity profile at 2.5 km elevation from that at ground level , we end up with a positive result over the dyke and negative results over the immediate margins of the dyke. The negative values cover a much wider zone than the positive values. Hence, at the resolution of GRAIL, the dense basalt dykes yield a negative gravity gradient signature. I warned you it was kind of complicated !!
Proudly powered by Weebly
